Electric Vehicles Market Growth, Size, Trends, Revenue, Demand, Challenges and Future Outlook
Electric Vehicle (EV) Market Size- By Component, By Vehicle Type, By Vehicle Class, By Top Speed, By Vehicle Drive Type, By EV Charging Point Type, By Vehicle Connectivity, By End Use, By Propulsion- Regional Outlook, Competitive Strategies and Segment Forecast to 2033
| Published: Jul-2021 | Report ID: AMIN2101 | Pages: 1 - 368 | Formats*: |
| Category : Automotive & Transportation | |||

| Report Metric | Details |
| Market size available for years | 2019-2033 |
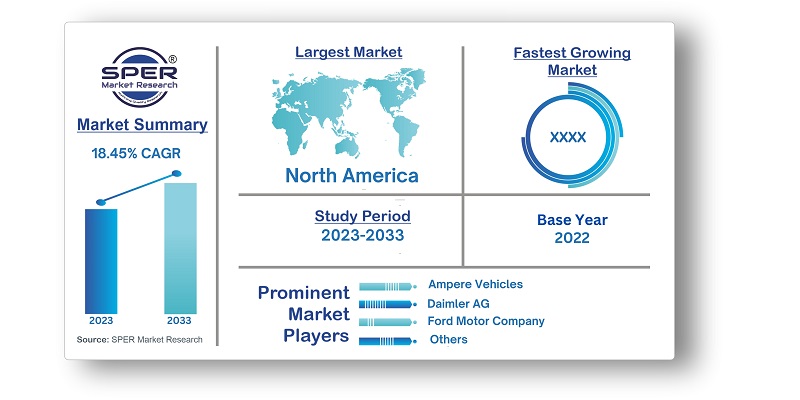
| Base year considered | 2022 |
| Forecast period | 2023-2033 |
| Segments covered | By Component, By Vehicle Type, By Vehicle Class, By Top Speed, By Vehicle Drive Type, By EV Charging Point Type, By Vehicle Connectivity, By End Use, By Propulsion |
| Regions covered | Asia-Pacific, Europe, Middle East and Africa, North America, Latin America |
| Companies Covered | Ampere Vehicles, Benling India Energy and Technology Pvt Ltd, BMW AG, BYD Company Limited, Chevrolet Motor Company, Daimler AG, Energica Motor Company S.p.A., Ford Motor Company, General Motors, Hero Electric, Hyundai Motor Company, Karma Automotive, Kia Corporation, Lucid Group Inc., Mahindra Electric Mobility Limited, NIO, Nissan Motors Co. Ltd., Okinawa Autotech Pvt. Ltd., Rivain, Tata Motors, Tesla Inc., Toyota Motor Corporation, Volkswagen AG, WM Motor, Xiaopeng Motors, Others |
- Urban dwellers and commuters seeking environmentally-friendly transportation options
- Fleet operators and logistics companies looking to adopt electric vehicles for cost savings and operational efficiency
- Automakers and manufacturers of electric vehicles, as well as their suppliers and partners
- Global Electric Vehicle Market Value Share and Forecast, By Component, 2023-2033
- Battery Cells & Packs
- On-Board Charge
- Motor
- Reducer
- Fuel Stack
- Power Control Unit
- Battery Management System
- Fuel Processor
- Power Conditioner
- Air Compressor
- Humidifier
- Global Electric Vehicle Market Value Share and Forecast, By Vehicle Type, 2023-2033
- Passenger Cars
- Commercial Vehicles
- Global Electric Vehicle Market Value Share and Forecast, By Vehicle Class, 2023-2033
- Low-Priced
- Mid-Priced
- Luxury
- Global Electric Vehicle Market Value Share and Forecast, By Top Speed, 2023-2033
- Less than 125 MPH
- Greater than 125 MPH
- Asia-Pacific
- Europe
- Middle East & Africa
- North America
- Latin America
- Global Electric Vehicle Market Size (FY’2023-FY’2033)
- Overview of Global Electric Vehicle Market
- Segmentation of Global Video Editing Platform Market By Component (Battery Cells & Packs, On-Board Charge, Motor, Reducer, Fuel Stack, Power Control Unit, Battery Management System, Fuel Processor, Power Conditioner, Air Compressor, Humidifier)
- Segmentation of Global Video Editing Software Market By Vehicle Type (Passenger Cars, Commercial Vehicles)
- Segmentation of Global Video Editing Software Market By Vehicle Class (Low-Priced, Mid-Priced, Luxury)
- Segmentation of Global Video Editing Software Market By Top Speed (Less than 125 MPH, Greater than 125 MPH)
- Segmentation of Global Video Editing Software Market By Vehicle Drive Type (Front Wheel Drive, Rear Wheel Drive, All Wheel Drive)
- Segmentation of Global Video Editing Software Market By EV Charging Point Type (Normal Charging, Super Charging)
- Segmentation of Global Video Editing Software Market By Vehicle Connectivity (V2B or V2H, V2G, V2V, V2X)
- Segmentation of Global Video Editing Software Market By Propulsion (BEV, PHEV, FCEV)
- Segmentation of Global Video Editing Software Market By End Use (Private, Commercial Fleets)
- Statistical Snap of Global Electric Vehicle Market
- Growth Analysis of Global Electric Vehicle Market
- Problems and Challenges in Global Electric Vehicle Market
- Competitive Landscape in the Global Electric Vehicle Market
- Impact of COVID-19 and Demonetization on Global Electric Vehicle Market
- Details on Recent Investment in Global Electric Vehicle Market
- Competitive Analysis of Global Electric Vehicle Market
- Key Players in the Global Electric Vehicle Market
- SWOT Analysis of Global Electric Vehicle Market
- Global Electric Vehicle Market Future Outlook and Projections (FY’2023-FY’2033)
- Recommendations from Analyst
1.1. Scope of the report1.2. Market segment analysis
2.1. Research data source2.1.1. Secondary Data2.1.2. Primary Data2.1.3. SPER’s internal database2.1.4. Premium insight from KOL’s2.2. Market size estimation2.2.1. Top-down and Bottom-up approach2.3. Data triangulation
4.1. Driver, Restraint, Opportunity and Challenges analysis4.1.1. Drivers4.1.2. Restraints4.1.3. Opportunities4.1.4. Challenges4.2. COVID-19 Impacts of the Global Electric Vehicle Market
5.1. SWOT Analysis5.1.1. Strengths5.1.2. Weaknesses5.1.3. Opportunities5.1.4. Threats5.2. PESTEL Analysis5.2.1. Political Landscape5.2.2. Economic Landscape5.2.3. Social Landscape5.2.4. Technological Landscape5.2.5. Environmental Landscape5.2.6. Legal Landscape5.3. PORTER’s Five Forces5.3.1. Bargaining power of suppliers5.3.2. Bargaining power of buyers5.3.3. Threat of Substitute5.3.4. Threat of new entrant5.3.5. Competitive rivalry5.4. Heat Map Analysis
6.1. Global Electric Vehicle Market Manufacturing Base Distribution, Sales Area, Product Type6.2. Mergers & Acquisitions, Partnerships, Product Launch, and Collaboration in Global Electric Vehicle Market
7.1. Global Electric Vehicle Market Value Share and Forecast, By Component, 2023-20337.2. Battery Cells & Packs7.3. On-Board Charge7.4. Motor7.5. Reducer7.6. Fuel Stack7.7. Power Control Unit7.8. Battery Management System7.9. Fuel Processor7.10. Power Conditioner7.11. Air Compressor7.12. Humidifier
8.1. Global Electric Vehicle Market Value Share and Forecast, By Vehicle Type, 2023-20338.2. Passenger Cars8.3. Commercial Vehicles
9.1. Global Electric Vehicle Market Value Share and Forecast, By Vehicle Class, 2023-20339.2. Low-Priced9.3. Mid-Priced9.4. Luxury
10.1. Global Electric Vehicle Market Value Share and Forecast, By Top Speed, 2023-203310.2. Less than 125 MPH10.3. Greater than 125 MPH
11.1. Global Electric Vehicle Market Value Share and Forecast, By Vehicle Drive Type, 2023-203311.2. Front Wheel Drive11.3. Rear Wheel Drive11.4. All Wheel Drive
12.1. Global Electric Vehicle Market Value Share and Forecast, By EV Charging Point Type, 2023-203312.2. Normal Charging12.3. Super Charging
13.1. Global Electric Vehicle Market Value Share and Forecast, By Vehicle Connectivity, 2023-203313.2. V2B or V2H13.3. V2G13.4. V2V13.5. V2X
14.1. Global Electric Vehicle Market Value Share and Forecast, By Propulsion, 2023-203314.2. BEV14.3. PHEV14.4. FCEV
15.1. Global Electric Vehicle Market Value Share and Forecast, By End Use, 2023-203315.2. Private15.3. Commercial Fleets
16.1. Global Electric Vehicle Market Size and Market Share
17.1. Global Electric Vehicle Market Size and Market Share By Component (2019-2026)17.2. Global Electric Vehicle Market Size and Market Share By Component (2027-2033)
18.1. Global Electric Vehicle Market Size and Market Share By Vehicle Type (2019-2026)18.2. Global Electric Vehicle Market Size and Market Share By Vehicle Type (2027-2033)
19.1. Global Electric Vehicle Market Size and Market Share By Vehicle Class (2019-2026)19.2. Global Electric Vehicle Market Size and Market Share By Vehicle Class (2027-2033)
20.1. Global Electric Vehicle Market Size and Market Share By Top Speed (2019-2026)20.2. Global Electric Vehicle Market Size and Market Share By Top Speed (2027-2033)21. Global Electric Vehicle Market, By Vehicle Drive Type, 2019-2033 (USD Million)
21.2. Global Electric Vehicle Market Size and Market Share By Vehicle Drive Type (2027-2033)
22.1. Global Electric Vehicle Market Size and Market Share By EV Charging Point Type (2019-2026)22.2. Global Electric Vehicle Market Size and Market Share By EV Charging Point Type (2027-2033)
23.1. Global Electric Vehicle Market Size and Market Share By Vehicle Connectivity (2019-2026)23.2. Global Electric Vehicle Market Size and Market Share By Vehicle Connectivity (2027-2033)
24.1. Global Electric Vehicle Market Size and Market Share By Propulsion (2019-2026)24.2. Global Electric Vehicle Market Size and Market Share By Propulsion (2027-2033)25. Global Electric Vehicle Market, By End Use, 2019-2033 (USD Million)
25.2. Global Electric Vehicle Market Size and Market Share By End Use (2027-2033)
26.1. Global Electric Vehicle Market Size and Market Share By Region (2019-2026)26.2. Global Electric Vehicle Market Size and Market Share By Region (2027-2033)26.3. Asia-Pacific26.3.1. Australia26.3.2. China26.3.3. India26.3.4. Japan26.3.5. South Korea26.3.6. Rest of Asia-Pacific26.4. Europe26.4.1. France26.4.2. Germany26.4.3. Italy26.4.4. Spain26.4.5. United Kingdom26.4.6. Rest of Europe26.5. Middle East and Africa26.5.1. Kingdom of Saudi Arabia26.5.2. United Arab Emirates26.5.3. Rest of Middle East & Africa26.6. North America26.6.1. Canada26.6.2. Mexico26.6.3. United States26.7. Latin America26.7.1. Argentina26.7.2. Brazil26.7.3. Rest of Latin America
27.1. Ampere Vehicles27.1.1. Company details27.1.2. Financial outlook27.1.3. Product summary27.1.4. Recent developments27.2. Benling India Energy and Technology Pvt Ltd27.2.1. Company details27.2.2. Financial outlook27.2.3. Product summary27.2.4. Recent developments27.3. BMW AG27.3.1. Company details27.3.2. Financial outlook27.3.3. Product summary27.3.4. Recent developments27.4. BYD Company Limited27.4.1. Company details27.4.2. Financial outlook27.4.3. Product summary27.4.4. Recent developments27.5. Chevrolet Motor Company27.5.1. Company details27.5.2. Financial outlook27.5.3. Product summary27.5.4. Recent developments27.6. Daimler AG27.6.1. Company details27.6.2. Financial outlook27.6.3. Product summary27.6.4. Recent developments27.7. Energica Motor Company S.p.A.27.7.1. Company details27.7.2. Financial outlook27.7.3. Product summary27.7.4. Recent developments27.8. Ford Motor Company27.8.1. Company details27.8.2. Financial outlook27.8.3. Product summary ‘27.8.4. Recent developments27.9. General Motors27.9.1. Company details27.9.2. Financial outlook27.9.3. Product summary27.9.4. Recent developments27.10. Hero Electric27.10.1. Company details27.10.2. Financial outlook27.10.3. Product summary27.10.3. Recent developments27.11. Hyundai Motor Company27.11.1. Company details27.11.2. Financial outlook27.11.3. Product summary27.11.4. Recent developments27.12. Karma Automotive27.12.1. Company details27.12.2. Financial outlook27.12.3. Product summary27.12.4. Recent developments27.13. Kia Corporation27.13.1. Company details27.13.2. Financial outlook27.13.3. Product summary27.13.4. Recent developments27.14. Lucid Group, Inc.27.14.1. Company details27.14.2. Financial outlook27.14.3. Product summary27.14.4. Recent developments27.15. Mahindra Electric Mobility Limited27.15.1. Company details27.15.2. Financial outlook27.15.3. Product summary27.15.4. Recent developments27.16. NIO27.16.1. Company details27.16.2. Financial outlook27.16.3. Product summary27.16.4. Recent developments27.17. Nissan Motors Co. Ltd.27.17.1. Company details27.17.2. Financial outlook27.17.3. Product summary27.17.4. Recent developments27.18. Okinawa Autotech Pvt. Ltd.27.18.1. Company details27.18.2. Financial outlook27.18.3. Product summary27.18.4. Recent developments27.19. Rivain27.19.1. Company details27.19.2. Financial outlook27.19.3. Product summary27.19.4. Recent developments27.20. Tata Motors27.20.1. Company details27.20.2. Financial outlook27.20.3. Product summary27.20.4. Recent developments27.21. Tesla Inc.27.21.1. Company details27.21.2. Financial outlook27.21.3. Product summary27.21.4. Recent developments27.22. Toyota Motor Corporation27.22.1. Company details27.22.2. Financial outlook27.22.3. Product summary27.22.4. Recent developments27.23. Volkswagen AG27.23.1. Company details27.23.2. Financial outlook27.23.3. Product summary27.23.4. Recent developments27.24. WM Motor27.24.1. Company details27.24.2. Financial outlook27.24.3. Product summary27.24.4. Recent developments27.25. Xiaopeng Motors27.25.1. Company details27.25.2. Financial outlook27.25.3. Product summary27.25.4. Recent developments27.26. Others
SPER Market Research’s methodology uses great emphasis on primary research to ensure that the market intelligence insights are up to date, reliable and accurate. Primary interviews are done with players involved in each phase of a supply chain to analyze the market forecasting. The secondary research method is used to help you fully understand how the future markets and the spending patterns look likes.
The report is based on in-depth qualitative and quantitative analysis of the Product Market. The quantitative analysis involves the application of various projection and sampling techniques. The qualitative analysis involves primary interviews, surveys, and vendor briefings. The data gathered as a result of these processes are validated through experts opinion. Our research methodology entails an ideal mixture of primary and secondary initiatives.


Frequently Asked Questions About This Report
PLACE AN ORDER
Year End Discount
Sample Report
Pre-Purchase Inquiry
NEED CUSTOMIZATION?
Request CustomizationCALL OR EMAIL US
100% Secure Payment