Asia Pacific Busbar Market Growth, Size, Trends, Demand, Revenue, Share and Future Competition
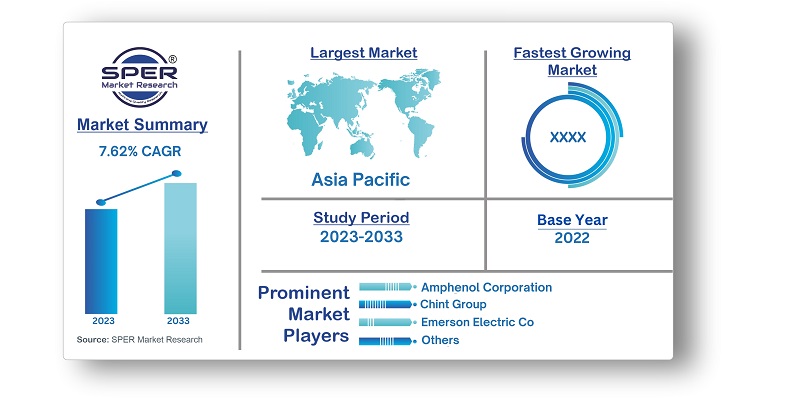
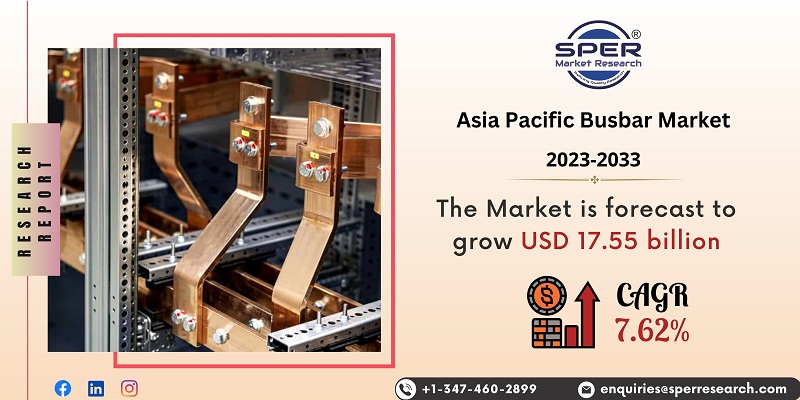
Asia Pacific Busbar Market Size- By Conductor, By Weight, By Shape, By Insulation, By Length, By Busbar Type, By Power Rating, By End User- Regional Outlook, Competitive Strategies and Segment Forecast to 2033
| Published: Jun-2023 | Report ID: AMIN2396 | Pages: 1 - 155 | Formats*: |
| Category : Automotive & Transportation | |||
| Report Metric | Details |
| Market size available for years | 2019-2033 |
| Base year considered | 2022 |
| Forecast period | 2023-2033 |
| Segments covered | By Conductor, By Weight, By Shape, By Insulation, By Length, By Busbar Type, By Power Rating, By End User |
| Regions covered | Australia, China, India, Indonesia, Japan, Malaysia, Philippines, Singapore, South Korea, Thailand, Rest of Asia-Pacific |
| Companies Covered | Amphenol Corporation, Chint Group, Eaton, Emerson Electric Co., General Electric, Legrand SA, Mersen Property, Methode Electronics, Oriental Copper Co., Ltd., Rittal Gmbh & Co. Kg, Rogers Corporation, Schneider Electric, Siemens AG, Sun. King Technology Group Limited, Others |
- Consulting Firms
- End-users
- Government Organizations and Regulatory Authorities
- Industry Players
- Investors
- Research and Development Institutions
- Trade Associations and Industry Groups
- Asia Pacific Busbar Market Value Share and Forecast, By Conductor, 2023-2033
- Aluminium
- Copper
- Asia Pacific Busbar Market Value Share and Forecast, By Weight, 2023-2033
- Less than 1Kg
- More than 1 Kg
- Asia Pacific Busbar Market Value Share and Forecast, By Shape, 2023-2033
- Chamfer
- Rectangular
- Asia Pacific Busbar Market Value Share and Forecast, By Insulation, 2023-2033
- Epoxy Power Coating
- Kapton
- Mylar
- Nomex
- Tedler
- Teonix
- Australia
- China
- India
- Indonesia
- Japan
- Malaysia
- Philippines
- Singapore
- South Korea
- Thailand
- Rest of Asia-Pacific
- Asia Pacific Busbar Market Size (FY’2023-FY’2033)
- Overview of Asia Pacific Busbar Market
- Segmentation of Asia Pacific Busbar Market By Conductor (Aluminium, Copper)
- Segmentation of Asia Pacific Busbar Market By Weight (Less than 1Kg, more than 1 Kg)
- Segmentation of Asia Pacific Busbar Market By Shape (Chamfer, Rectangular)
- Segmentation of Asia Pacific Busbar Market By Insulation (Epoxy Power Coating, Kapton, Mylar, Nomex, Tedler, Teonix)
- Segmentation of Asia Pacific Busbar Market By Length (Less than 1 m, 1m to 2m, 2 m to 3m, more than 3m)
- Segmentation of Asia Pacific Busbar Market By Busbar Type (Flexible Busbar, Laminated Busbar, Multiple Conductor Busbar, Single Conductor Busbar)
- Segmentation of Asia Pacific Busbar Market By Power Rating (Low Power, Medium Power, High Power)
- Segmentation of Asia Pacific Busbar Market By End User (Commercial, Industrial, Residential)
- Statistical Snap of Asia Pacific Busbar Market
- Growth Analysis of Asia Pacific Busbar Market
- Problems and Challenges in Asia Pacific Busbar Market
- Competitive Landscape in the Asia Pacific Busbar Market
- Impact of COVID-19 and Demonetization on Asia Pacific Busbar Market
- Details on Recent Investment in Asia Pacific Busbar Market
- Competitive Analysis of Asia Pacific Busbar Market
- Key Players in the Asia Pacific Busbar Market
- SWOT Analysis of Asia Pacific Busbar Market
- Asia Pacific Busbar Market Future Outlook and Projections (FY’2023-FY’2033)
- Recommendations from Analyst
1.1. Scope of the report1.2. Market segment analysis
2.1. Research data source2.1.1. Secondary Data2.1.2. Primary Data2.1.3. SPER’s internal database2.1.4. Premium insight from KOL’s2.2. Market size estimation2.2.1. Top-down and Bottom-up approach2.3. Data triangulation
4.1. Driver, Restraint, Opportunity and Challenges analysis4.1.1. Drivers4.1.2. Restraints4.1.3. Opportunities4.1.4. Challenges4.2. COVID-19 Impacts of the Asia Pacific Busbar Market
5.1. SWOT Analysis5.1.1. Strengths5.1.2. Weaknesses5.1.3. Opportunities5.1.4. Threats5.2. PESTEL Analysis5.2.1. Political Landscape5.2.2. Economic Landscape5.2.3. Social Landscape5.2.4. Technological Landscape5.2.5. Environmental Landscape5.2.6. Legal Landscape5.3. PORTER’s Five Forces5.3.1. Bargaining power of suppliers5.3.2. Bargaining power of buyers5.3.3. Threat of Substitute5.3.4. Threat of new entrant5.3.5. Competitive rivalry5.4. Heat Map Analysis
6.1. Asia Pacific Busbar Market Manufacturing Base Distribution, Sales Area, Product Type6.2. Mergers & Acquisitions, Partnerships, Product Launch, and Collaboration in Asia Pacific Busbar Market
7.1. Asia Pacific Busbar Market Value Share and Forecast, By Conductor, 2023-20337.2. Aluminium7.3. Copper
8.1. Asia Pacific Busbar Market Value Share and Forecast, By Weight, 2023-20338.2. Less than 1Kg8.3. More than 1 Kg
9.1. Asia Pacific Busbar Market Value Share and Forecast, By Shape, 2023-20339.2. Chamfer9.3. Rectangular
10.1. Asia Pacific Busbar Market Value Share and Forecast, By Insulation, 2023-203310.2. Epoxy Power Coating10.3. Kapton10.4. Mylar10.5. Nomex10.6. Tedler10.7. Teonix
11.1. Asia Pacific Busbar Market Value Share and Forecast, By Length, 2023-203311.2. Less than 1 m11.3. 1m to 2m11.4. 2 m to 3m11.5. More than 3m
12.1. Asia Pacific Busbar Market Value Share and Forecast, By Busbar Type, 2023-203312.2. Flexible Busbar12.3. Laminated Busbar12.4. Multiple Conductor Busbar12.5. Single Conductor Busbar
13.1. Asia Pacific Busbar Market Value Share and Forecast, By Power Rating, 2023-203313.2. Low Power13.3. Medium Power (125 A-800 A)13.4. High Power (Above 800 A)
14.1. Asia Pacific Busbar Market Value Share and Forecast, By End User, 2023-203314.2. Commercial14.3. Industrial14.4. Residential
15.1. Asia Pacific Busbar Market Size and Market Share
16.1. Asia Pacific Busbar Market Size and Market Share by Conductor (2019-2026)16.2. Asia Pacific Busbar Market Size and Market Share by Conductor (2027-2033)
17.1. 94Asia Pacific Busbar Market Size and Market Share by Weight (2019-2026)17.2. Asia Pacific Busbar Market Size and Market Share by Weight (2027-2033)
18.1. Asia Pacific Busbar Market Size and Market Share by Shape (2019-2026)18.2. Asia Pacific Busbar Market Size and Market Share by Shape (2027-2033)
19.1. Asia Pacific Busbar Market Size and Market Share by Insulation (2019-2026)19.2. Asia Pacific Busbar Market Size and Market Share by Insulation (2027-2033)
20.1. Asia Pacific Busbar Market Size and Market Share by Length (2019-2026)20.2. Asia Pacific Busbar Market Size and Market Share by Length (2027-2033)
21.1. Asia Pacific Busbar Market Size and Market Share by Busbar Type (2019-2026)21.2. Asia Pacific Busbar Market Size and Market Share by Busbar Type (2027-2033)
22.1. Asia Pacific Busbar Market Size and Market Share by Power Rating (2019-2026)22.2. Asia Pacific Busbar Market Size and Market Share by Power Rating (2027-2033)
23.1. Asia Pacific Busbar Market Size and Market Share by End User (2019-2026)23.2. Asia Pacific Busbar Market Size and Market Share by End User (2027-2033)
24.1. Asia Pacific Busbar Market Size and Market Share by Region (2019-2026)24.2. Asia Pacific Busbar Market Size and Market Share by Region (2027-2033)24.3. Australia24.4. China24.5. India24.6. Indonesia24.7. Japan24.8. Malaysia24.9. Philippines24.10. Singapore24.11. South Korea24.12. Thailand24.13. Rest of Asia-Pacific
25.1. Amphenol Corporation25.1.1. Company details25.1.2. Financial outlook25.1.3. Product summary25.1.4. Recent developments25.2. Chint Group25.2.1. Company details25.2.2. Financial outlook25.2.3. Product summary25.2.4. Recent developments25.3. Eaton25.3.1. Company details25.3.2. Financial outlook25.3.3. Product summary25.3.4. Recent developments25.4. Emerson Electric Co.25.4.1. Company details25.4.2. Financial outlook25.4.3. Product summary25.4.4. Recent developments25.5. General Electric25.5.1. Company details25.5.2. Financial outlook25.5.3. Product summary25.5.4. Recent developments25.6. Legrand SA25.6.1. Company details25.6.2. Financial outlook25.6.3. Product summary25.6.4. Recent developments25.7. Mersen Property25.7.1. Company details25.7.2. Financial outlook25.7.3. Product summary25.7.4. Recent developments25.8. Methode Electronics25.8.1. Company details25.8.2. Financial outlook25.8.3. Product summary25.8.4. Recent developments25.9. Oriental Copper Co., Ltd.25.9.1. Company details25.9.2. Financial outlook25.9.3. Product summary25.9.4. Recent developments25.10. Rittal Gmbh & Co. Kg25.10.1. Company details25.10.2. Financial outlook25.10.3. Product summary25.10.4. Recent developments25.11. Rogers Corporation25.11.1. Company details25.11.2. Financial outlook25.11.3. Product summary25.11.4. Recent developments25.12. Schneider Electric25.12.1. Company details25.12.2. Financial outlook25.12.3. Product summary25.12.4. Recent developments25.13. Siemens AG25.13.1. Company details25.13.2. Financial outlook25.13.3. Product summary25.13.4. Recent developments25.14. Sun. King Technology Group Limited.25.14.1. Company details25.14.2. Financial outlook25.14.3. Product summary25.14.4. Recent developments25.15. Others
SPER Market Research’s methodology uses great emphasis on primary research to ensure that the market intelligence insights are up to date, reliable and accurate. Primary interviews are done with players involved in each phase of a supply chain to analyze the market forecasting. The secondary research method is used to help you fully understand how the future markets and the spending patterns look likes.
The report is based on in-depth qualitative and quantitative analysis of the Product Market. The quantitative analysis involves the application of various projection and sampling techniques. The qualitative analysis involves primary interviews, surveys, and vendor briefings. The data gathered as a result of these processes are validated through experts opinion. Our research methodology entails an ideal mixture of primary and secondary initiatives.


Frequently Asked Questions About This Report
PLACE AN ORDER
Year End Discount
Sample Report
Pre-Purchase Inquiry
NEED CUSTOMIZATION?
Request CustomizationCALL OR EMAIL US
100% Secure Payment