Australia Ammonia Market Growth, Size, Trends, Share, Revenue, Demand and Future Outlook
Australia Ammonia Market Size– By Product Type, By End User, By Application- Regional Outlook, Competitive Strategies and Segment Forecast to 2033
| Published: Feb-2024 | Report ID: POAE2420 | Pages: 1 - 107 | Formats*: |
| Category : Power & Energy | |||
- September 2019: Queensland Nitrates Pty Ltd. (QNP), a nitrogenous fertilizer manufacturer in Australia, received US$ 1.90 million from the Australian Renewable Energy Agency (ARENA) on behalf of the Australian Government to evaluate the viability of building and running a renewable ammonia plant at its current facility near Moura in Central Queensland.
- October 2019: The Australian government provided US$ 1.93 million in funding for two studies aimed at investigating the viability of producing ammonia by green hydrogen electrolysis from solar and wind power.
| Report Metric | Details |
| Market size available for years | 2020-2033 |
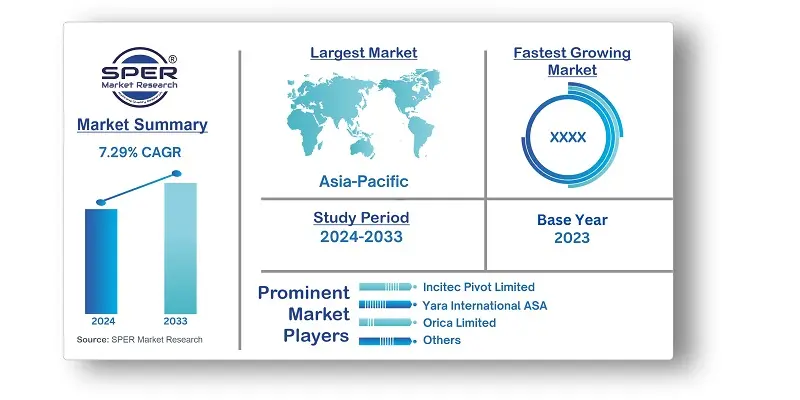
| Base year considered | 2023 |
| Forecast period | 2024-2033 |
| Segments covered | By Product Type, By End-Use, By Application |
| Regions covered | New South Wales, Queensland, Victoria, Western Australia, Rest of Australia |
| Companies Covered | Incitec Pivot Limited, Yara International ASA, Orica Limited, and Wesfarmers Chemicals, Energy & Fertilisers and various others. |
- Parents and Caregivers
- Manufacturers and Suppliers
- Healthcare Professionals
- Government and Regulatory Bodies
- Investors and Financial Institutions
- Marketing and Advertising Agencies
- Non-Governmental Organizations (NGOs)
- Research and Development Professionals
- Educational Institutions
- Environmental Advocates
| By Product Type: |
|
| By End-Use: |
|
| By Application: |
|
- Australia Ammonia Market Size (FY’2024-FY’2033)
- Overview of Australia Ammonia Market
- Segmentation of Australia Ammonia Market By Product Type (Anhydrous Ammonia, Aqueous Ammonia)
- Segmentation of Australia Ammonia Market By End-Use (Ammonium Nitrate, Nitric Acid, Ammonium Sulphate, Urea, Diammonium Phosphate (DAP), Mono Ammonium Phosphate (MAP), Others)
- Segmentation of Australia Ammonia Market By Application (Agrochemicals, Industrial Chemicals, Explosives, Others)
- Statistical Snap of Australia Ammonia Market
- Expansion Analysis of Australia Ammonia Market
- Problems and Obstacles in Australia Ammonia Market
- Competitive Landscape in the Australia Ammonia Market
- Impact of COVID-19 and Demonetization on Australia Ammonia Market
- Details on Current Investment in Australia Ammonia Market
- Competitive Analysis of Australia Ammonia Market
- Prominent Players in the Australia Ammonia Market
- SWOT Analysis of Australia Ammonia Market
1.1. Scope of the report1.2. Market segment analysis
2.1. Research data source2.1.1. Secondary Data2.1.2. Primary Data2.1.3. SPER’s internal database2.1.4. Premium insight from KOL’s2.2. Market size estimation2.2.1. Top-down and Bottom-up approach
2.3. Data triangulation
4.1. Driver, Restraint, Opportunity and Challenges analysis
4.1.1. Drivers4.1.2. Restraints4.1.3. Opportunities4.1.4. Challenges
4.2. COVID-19 Impact of the Australia Ammonia Market
5.1. SWOT Analysis5.1.1. Strengths5.1.2. Weaknesses5.1.3. Opportunities5.1.4. Threats5.2. PESTEL Analysis5.2.1. Political Landscape5.2.2. Economic Landscape5.2.3. Social Landscape5.2.4. Technological Landscape5.2.5. Environmental Landscape5.2.6. Legal Landscape5.3. PORTER’s Five Forces5.3.1. Bargaining power of suppliers5.3.2. Bargaining power of buyers5.3.3. Threat of Substitute5.3.4. Threat of new entrant5.3.5. Competitive rivalry5.4. Heat Map Analysis
6.1. Australia Ammonia Market Manufacturing Base Distribution, Sales Area, End-Use, Chassis End-Use6.2. Mergers & Acquisitions, Partnerships, End-Use Launch, and Collaboration in Australia Ammonia Market
7.1. Australia Ammonia Market Value Share and Forecast, By Product End-Use, 2023-20337.2. Anhydrous Ammonia7.3. Aqueous Ammonia
8.1. Australia Ammonia Market Value Share and Forecast, By End-Use, 2024-20338.2. Ammonium Nitrate8.3. Ammonium Sulphate8.4. Mono Ammonium Phosphate (MAP)8.5. Nitric Acid8.6. Urea, Diammonium Phosphate (DAP)8.7. Others
9.1. Australia Ammonia Market Value Share and Forecast, By Application, 2024-20339.2. Agrochemicals9.3. Explosives9.4. Industrial Chemicals9.5. Others
10.1. Australia Ammonia Market Size and Market Share
11.1. Australia Ammonia Market Size and Market Share By Product Type (2020-2026)11.2. Australia Ammonia Market Size and Market Share By Product Type (2027-2033)
12.1. Australia Ammonia Market Size and Market Share By End-Use (2020-2026)12.2. Australia Ammonia Market Size and Market Share By End-Use (2027-2033)
13.1. Australia Ammonia Market Size and Market Share By Application (2020-2026)13.2. Australia Ammonia Market Size and Market Share By Application (2027-2033)
14.1. Australia Ammonia Market Size and Market Share By Region (2020-2026)14.2. Australia Ammonia Market Size and Market Share By Region (2027-2033)14.2.1. New South Wales14.2.2. Queensland14.2.3. Victoria14.2.4. Western Australia
14.2.5. Rest of Australia
15.1. Energy & Fertilisers15.1.1. Company details15.1.2. Financial outlook15.1.3. End-Use summary15.1.4. Recent developments15.2. Incitec Pivot Limited15.2.1. Company details15.2.2. Financial outlook15.2.3. End-Use summary15.2.4. Recent developments15.3. Orica Limited15.3.1. Company details15.3.2. Financial outlook15.3.3. End-Use summary15.3.4. Recent developments15.4. Wesfarmers Chemicals15.4.1. Company details15.4.2. Financial outlook15.4.3. End-Use summary15.4.4. Recent developments15.5. Yara International ASA15.5.1. Company details15.5.2. Financial outlook15.5.3. End-Use summary15.5.4. Recent developments15.6. Others
SPER Market Research’s methodology uses great emphasis on primary research to ensure that the market intelligence insights are up to date, reliable and accurate. Primary interviews are done with players involved in each phase of a supply chain to analyze the market forecasting. The secondary research method is used to help you fully understand how the future markets and the spending patterns look likes.
The report is based on in-depth qualitative and quantitative analysis of the Product Market. The quantitative analysis involves the application of various projection and sampling techniques. The qualitative analysis involves primary interviews, surveys, and vendor briefings. The data gathered as a result of these processes are validated through experts opinion. Our research methodology entails an ideal mixture of primary and secondary initiatives.


Frequently Asked Questions About This Report
PLACE AN ORDER
Year End Discount
Sample Report
Pre-Purchase Inquiry
NEED CUSTOMIZATION?
Request CustomizationCALL OR EMAIL US
100% Secure Payment