Automated Fare Collection Market Growth, Size, Trends, Demand, Revenue and Future Outlook
Automated Fare Collection Market Size- By Application, By Technology Software, By Component, By Vertical, By System- Regional Outlook, Competitive Strategies, and Segment Forecast to 2033
| Published: Jan-2024 | Report ID: MACH2404 | Pages: 1 - 244 | Formats*: |
| Category : Equipment and Machinery | |||
- June 2019: A deal to buy Alvarado Manufacturing Co. Inc., a top producer of physical access solutions including turnstiles and speed gates, was inked by Dormakaba Holding in June 2019.
- August 2018: To increase cloud-based capabilities for small and mid-sized transport operators, Cubic Transportation Systems, Inc. and Delerrok inked a contract in August 2018. Cubic uses its Transit Management as a Service (TMaaS) platform in conjunction with Delerrok's TouchPass technology to provide full payment and real-time information solutions at a reasonable cost.
| Report Metric | Details |
| Market size available for years | 2019-2033 |
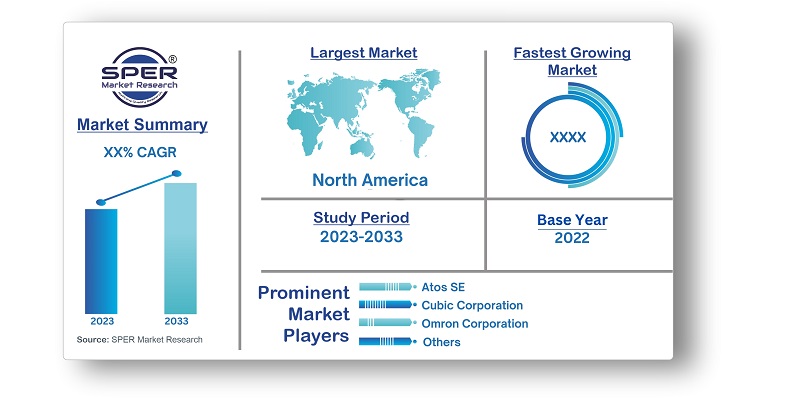
| Base year considered | 2022 |
| Forecast period | 2023-2033 |
| Segments covered | By Application, By Technology Software, By Component, By Vertical, By System |
| Regions covered | North America, Asia-Pacific, Latin America, Middle East & Africa and Europe |
| Companies Covered | Atos SE, Cubic Corporation, NXP Semiconductors N.V., Omron Corporation, Scheidt & Bachmann GmbH, LECIP Group, LG CNS, Samsung SDS, and Thales Group |
- Transportation authorities and agencies
- Government Authorities
- Technology providers
- system integrators
- Smart Card Manufacturers
- Financial institution
- Passenger and commuter community
| By Application: |
|
| By Technology Software: |
|
| By Vertical: |
|
| By Component: |
|
| By System: |
|
- Global Automated Fare Collection Market Size (FY’2023-FY’2033)
- Overview of Global Automated Fare Collection Market
- Segmentation of Global Automated Fare Collection Market By Application (Parking Applications, Rail and Transport, Theme Park Applications and others)
- Segmentation of Global Automated Fare Collection Market By Technology Software (Magnetic Strips, Near Field Communication, Optical Character Recognition, Smart Card and others)
- Segmentation of Global Automated Fare Collection Market By Vertical (Government, Media & Entertainment, Retail, Transportation and Logistics and others)
- Segmentation of Global Automated Fare Collection Market By Component (Hardware and software)
- Segmentation of Global Automated Fare Collection Market By System (Fare gates, IC Card, Ticket Office Machine, Ticket Vending Machine)
- Statistical Snap of Global Automated Fare Collection Market
- Expansion Analysis of Global Automated Fare Collection Market
- Problems and Obstacles in Global Automated Fare Collection Market
- Competitive Landscape in the Global Automated Fare Collection Market
- Impact of COVID-19 and Demonetization on Global Automated Fare Collection Market
- Details on Current Investment in Global Automated Fare Collection Market
- Competitive Analysis of Global Automated Fare Collection Market
- Prominent Players in the Global Automated Fare Collection Market
- SWOT Analysis of Global Automated Fare Collection Market
- Global Automated Fare Collection Market Future Outlook and Projections (FY’2023-FY’2033)
- Recommendations from Analyst
1.1. Scope of the report1.2. Market segment analysis
2.1. Research data source2.1.1. Secondary Data2.1.2. Primary Data2.1.3. SPER’s internal database2.1.4. Premium insight from KOL’s2.2. Market size estimation2.2.1. Top-down and Bottom-up approach2.3. Data triangulation
4.1. Driver, Restraint, Opportunity, and Challenges Analysis4.1.1. Drivers4.1.2. Restraints4.1.3. Opportunities4.1.4. Challenges4.2. COVID-19 Impacts of the Global Automated Fare Collection Market
5.1. SWOT Analysis5.1.1. Strengths5.1.2. Weaknesses5.1.3. Opportunities5.1.4. Threats5.2. PESTEL Analysis5.2.1. Political Landscape5.2.2. Economic Landscape5.2.3. Social Landscape5.2.4. Technological Landscape5.2.5. Environmental Landscape5.2.6. Legal Landscape5.3. PORTER’s Five Forces5.3.1. Bargaining power of suppliers5.3.2. Bargaining power of buyers5.3.3. Threat of Substitute5.3.4. Threat of new entrant5.3.5. Competitive rivalry5.4. Heat Map Analysis
6.1. Global Automated Fare Collection Market Manufacturing Base Distribution, Sales Area, Product Type6.2. Mergers & Acquisitions, Partnerships, Product Launch, and Collaboration in Global Automated Fare Collection Market
7.1. Global Automated Fare Collection Market Value Share and Forecast, By Application, 2023-20337.2. Parking applications7.3. Rail and Transport7.4. Theme park applications7.5. Others
8.1. Global Automated Fare Collection Market Value Share and Forecast, By Technology Software , 2023-20338.2. Magnetic Strips8.3. Near field communication8.4. Optical Character Recognition8.5. Smart card8.6. Others
9.1. Global Automated Fare Collection Market Value Share and Forecast, By Vertical, 2023-20339.2. Government9.3. Media & Entertainment9.4. Retail9.5. Transportation and logistics9.6. Others
10.1. Global Automated Fare Collection Market Value Share and Forecast, By Component, 2023-203310.2. Hardware10.3. Software
11.1. Global Automated Fare Collection Market Value Share and Forecast, By System, 2023-203311.2. Fare Gates11.3. IC Card11.4. Ticket Office Machine11.5. Ticket Vending Machine11.6. Others
12.1. Global Automated Fare Collection Market Size and Market Share
13.1. Global Automated Fare Collection Market Size and Market Share By Application (2019-2026)13.2. Global Automated Fare Collection Market Size and Market Share By Application (2027-2033)
14.1. Global Automated Fare Collection Market Size and Market Share By Technology Software (2019-2026)14.2. Global Automated Fare Collection Market Size and Market Share By Technology Software (2027-2033)
15.1. Global Automated Fare Collection Market Size and Market Share By Vertical (2019-2026)15.2. Global Automated Fare Collection Market Size and Market Share By Vertical (2027-2033)
16.1. Global Automated Fare Collection Market Size and Market Share By System (2019-2026)16.2. Global Automated Fare Collection Market Size and Market Share By System (2027-2033)
17.1. Global Automated Fare Collection Market Size and Market Share By Component (2019-2026)17.2. Global Automated Fare Collection Market Size and Market Share By Component (2027-2033)
18.1. Global Automated Fare Collection Market Size and Market Share By Region (2019-2026)18.2. Global Automated Fare Collection Market Size and Market Share By Region (2027-2033)18.3. Asia-Pacific18.3.1. Australia18.3.2. China18.3.3. India18.3.4. Japan18.3.5. South Korea18.3.6. Rest of Asia-Pacific18.4. Europe18.4.1. France18.4.2. Germany18.4.3. Italy18.4.4. Spain18.4.5. United Kingdom18.4.6. Rest of Europe18.5. Middle East and Africa18.5.1. Kingdom of Saudi Arabia18.5.2. United Arab Emirates18.5.3. Rest of Middle East & Africa18.6. North America18.6.1. Canada18.6.2. Mexico18.6.3. United States18.7. Latin America18.7.1. Argentina18.7.2. Brazil18.7.3. Rest of Latin America
19.1. Atos SE19.1.1. Company details19.1.2. Financial outlook19.1.3. Product summary19.1.4. Recent developments19.2. Cubic Transportation Systems, Inc.19.2.1. Company details19.2.2. Financial outlook19.2.3. Product summary19.2.4. Recent developments19.3. Dormakaba Holding19.3.1. Company details19.3.2. Financial outlook19.3.3. Product summary19.3.4. Recent developments19.4. LECIP Group19.4.1. Company details19.4.2. Financial outlook19.4.3. Product summary19.4.4. Recent developments19.5. LG CNS19.5.1. Company details19.5.2. Financial outlook19.5.3. Product summary19.5.4. Recent developments19.6. NXP semiconductors19.6.1. Company details19.6.2. Financial outlook19.6.3. Product summary19.6.4. Recent developments19.7. OMRON Corporation19.7.1. Company details19.7.2. Financial outlook19.7.3. Product summary19.7.4. Recent developments19.8. Samsung SDS19.8.1. Company details19.8.2. Financial outlook19.8.3. Product summary19.8.4. Recent developments19.9. Scheidt&bacchhan Gmbh19.9.1. Company details19.9.2. Financial outlook19.9.3. Product summary19.9.4. Recent developments19.10. Thales Group19.10.1. Company details19.10.2. Financial outlook19.10.3. Product summary19.10.4. Recent developments19.11. Others
SPER Market Research’s methodology uses great emphasis on primary research to ensure that the market intelligence insights are up to date, reliable and accurate. Primary interviews are done with players involved in each phase of a supply chain to analyze the market forecasting. The secondary research method is used to help you fully understand how the future markets and the spending patterns look likes.
The report is based on in-depth qualitative and quantitative analysis of the Product Market. The quantitative analysis involves the application of various projection and sampling techniques. The qualitative analysis involves primary interviews, surveys, and vendor briefings. The data gathered as a result of these processes are validated through experts opinion. Our research methodology entails an ideal mixture of primary and secondary initiatives.


Frequently Asked Questions About This Report
PLACE AN ORDER
Year End Discount
Sample Report
Pre-Purchase Inquiry
NEED CUSTOMIZATION?
Request CustomizationCALL OR EMAIL US
100% Secure Payment