Digital Utility Market Share, Trends Analysis and Outlook 2034

Digital Utility Market Growth, Size, Trends Analysis- By Technology, By Network - Regional Outlook, Competitive Strategies and Segment Forecast to 2034

Published: Jul-2025 Report ID: IACT25127 Pages: 1 - 237 Formats*:     
Category : Information & Communications Technology
Digital Utility Market Introduction and Overview  

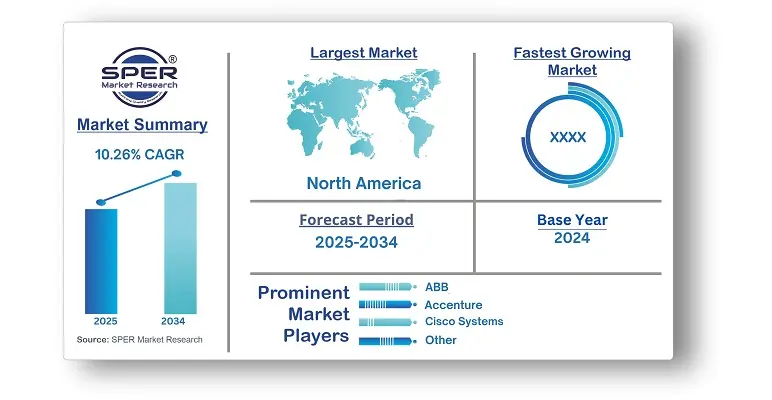
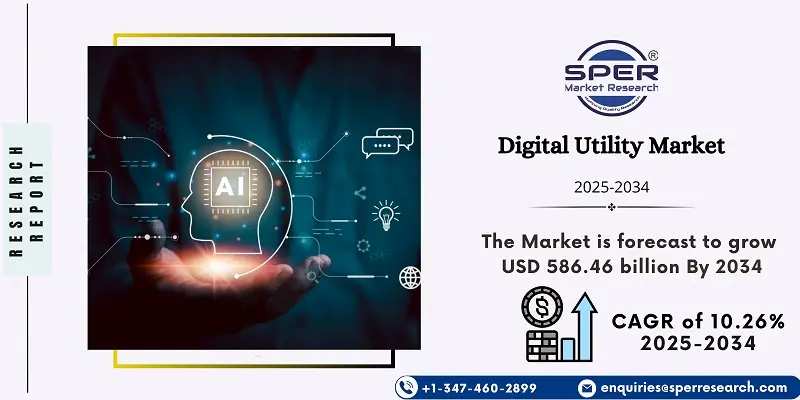
According to SPER Market Research, the Global Digital Utility Market is estimated to reach USD 586.46 billion by 2034 with a CAGR 10.26%.

The report includes an in-depth analysis of the Global Digital Utility Market, including market size and trends, product mix, Applications, and supplier analysis.The Digital Utility Market was valued at USD 220.83 billion in 2024 and is projected to increase at a compound annual growth rate (CAGR) of 10.26% between 2025 and 2034. The growth of the digital utility solutions market is driven by rising renewable power projects, energy efficiency mandates, and stringent regulations. Increasing demand for green energy and rapid digitalization, especially in countries like China and India, boost market expansion. These solutions help power plants operate efficiently, reduce emissions, and manage data from connected devices. Advanced technologies like AI, machine learning, and blockchain enhance predictive maintenance, safety, and customer satisfaction. Overall, the adoption of cutting-edge digital tools in the utility sector is transforming energy generation, distribution, and customer engagement.


By Technology:
The hardware segment leads the market due to advances and widespread use of smart meters, transformers, and intelligent devices, enabling predictive maintenance and real-time analytics. The integrated solutions segment is set for rapid growth, offering cloud and software services that digitize assets, optimize operations, and enhance reliability. Emerging technologies like IoT, AI, and big data analytics have transformed utility operations by enabling real-time monitoring and efficient energy management, improving overall efficiency and reducing operational costs.

By Network:
The transmission and distribution segment leads the market, driven by the need to monitor and manage electric grids, many of which are aging and require upgrades. Utilities are investing in advanced sensors, communication systems, and automation technologies for real-time grid monitoring, faster fault detection, and remote control. Meanwhile, the retail segment is expected to grow rapidly, fueled by data analytics for better customer management. Increasing consumer awareness of environmental issues is driving demand for renewable energy and sustainable utility practices.

Regional Insights:
North America leads the market, driven by rising renewable power plants, investments in electrical infrastructure, and growing digitalization with connected devices. The U.S. market benefits from government initiatives and environmental concerns boosting digital transformation. Europe focuses on integrating renewables and energy efficiency, supported by policies to reduce emissions and optimize consumption with digital tools. The UK sees strong demand for renewables and advanced grid management. Asia Pacific is growing fastest due to increasing electricity demand, regulatory support, and infrastructure development. India’s expanding middle class drives demand for reliable energy and digital platforms for better service and transparency.


Market Competitive Landscape:
The global Digital Utility Market is moderately consolidated, with several prominent players shaping the industry. Key companies include: ABB, Accenture, Cisco Systems, Honeywell International, International Business Machines Corporation (IBM), Microsoft, Oracle, SAP SE, Schneider Electric, and Siemens.

Recent Developments:
In May 2024, Honeywell International Inc. launched Honeywell Forge Performance+ for Utilities, a platform aimed at improving utility operations and the performance of grid assets. The solution combines AI, machine learning, and digital twin technology to monitor assets, diagnose root causes, and leverage predictive analytics for proactive management of the grid.
In February 2024, Siemens introduced Gridscale X, a modular software platform that helps utilities manage the energy transition. Gridscale X facilitates rapid scaling of grid capacity, manages the complexities of distributed energy resources (DERs), and enhances grid flexibility.

Scope of the report:
 Report Metric Details
 Market size available for years2021-2034
 Base year considered2024
 Forecast period2025-2034
 Segments coveredBy Technology, By Network
 Regions coveredNorth America, Latin America, Asia-Pacific, Europe, and Middle East & Africa
 Companies Covered
ABB, Accenture, Cisco Systems, Honeywell International, International Business Machines Corporation (IBM), Microsoft, Oracle, SAP SE, Schneider Electric, and Siemens.
Key Topics Covered in the Report
  • Global Digital Utility Market Size (FY’2021-FY’2034)
  • Overview of Global Digital Utility Market
  • Segmentation of Global Digital Utility Market By Technology (Hardware, Integrated Solutions)
  • Segmentation of Global Digital Utility Market By Network (Generation, Transmission & Distribution, Retail)
  • Statistical Snap of Global Digital Utility Market
  • Expansion Analysis of Global Digital Utility Market
  • Problems and Obstacles in Global Digital Utility Market
  • Competitive Landscape in the Global Digital Utility Market
  • Details on Current Investment in Global Digital Utility Market
  • Competitive Analysis of Global Digital Utility Market
  • Prominent Players in the Global Digital Utility Market
  • SWOT Analysis of Global Digital Utility Market
  • Global Digital Utility Market Future Outlook and Projections (FY’2025-FY’2034)
  • Recommendations from Analyst
1. Introduction
  • 1.1. Scope of the report
  • 1.2. Market segment analysis 
2. Research Methodology
  • 2.1. Research data source
    • 2.1.1. Secondary Data
    • 2.1.2. Primary Data
    • 2.1.3. SPERs internal database
    • 2.1.4. Premium insight from KOLs
  • 2.2. Market size estimation
    • 2.2.1. Top-down and Bottom-up approach
  • 2.3. Data triangulation
3. Executive Summary

4. Market Dynamics
  • 4.1. Driver, Restraint, Opportunity and Challenges analysis
    • 4.1.1. Drivers
    • 4.1.2. Restraints
    • 4.1.3. Opportunities
    • 4.1.4. Challenges
5. Market variable and outlook
  • 5.1. SWOT Analysis
    • 5.1.1. Strengths
    • 5.1.2. Weaknesses
    • 5.1.3. Opportunities
    • 5.1.4. Threats
  • 5.2. PESTEL Analysis
    • 5.2.1. Political Landscape
    • 5.2.2. Economic Landscape
    • 5.2.3. Social Landscape
    • 5.2.4. Technological Landscape
    • 5.2.5. Environmental Landscape
    • 5.2.6. Legal Landscape
  • 5.3. PORTERs Five Forces 
    • 5.3.1. Bargaining power of suppliers
    • 5.3.2. Bargaining power of buyers
    • 5.3.3. Threat of Substitute
    • 5.3.4. Threat of new entrant
    • 5.3.5. Competitive rivalry
  • 5.4. Heat Map Analysis
6. Competitive Landscape
  • 6.1. Global Digital Utility Market Manufacturing Base Distribution, Sales Area, Product Type 
  • 6.2. Mergers & Acquisitions, Partnerships, Product Launch, and Collaboration in Global Digital Utility Market
7. Global Digital Utility Market, By Technology, (USD Million) 2021-2034 
  • 7.1. Hardware
  • 7.2. Integrated Solutions
8. Global Digital Utility Market, By Network, (USD Million) 2021-2034 
  • 8.1. Generation
  • 8.2. Transmission & Distribution
  • 8.3. Retail
9. Global Digital Utility Market, (USD Million) 2021-2034 
  • 9.1. Global Digital Utility Market Size and Market Share
10. Global Digital Utility Market, By Region, 2021-2034 (USD Million)
  • 10.1. Asia-Pacific
    • 10.1.1. Australia
    • 10.1.2. China
    • 10.1.3. India
    • 10.1.4. Japan
    • 10.1.5. South Korea
    • 10.1.6. Rest of Asia-Pacific
  • 10.2. Europe
    • 10.2.1. France
    • 10.2.2. Germany
    • 10.2.3. Italy
    • 10.2.4. Spain
    • 10.2.5. United Kingdom
    • 10.2.6. Rest of Europe
  • 10.3. Middle East and Africa
    • 10.3.1. Kingdom of Saudi Arabia 
    • 10.3.2. United Arab Emirates
    • 10.3.3. Qatar
    • 10.3.4. South Africa
    • 10.3.5. Egypt
    • 10.3.6. Morocco
    • 10.3.7. Nigeria
    • 10.3.8. Rest of Middle-East and Africa
  • 10.4. North America
    • 10.4.1. Canada
    • 10.4.2. Mexico
    • 10.4.3. United States
  • 10.5. Latin America
    • 10.5.1. Argentina
    • 10.5.2. Brazil
    • 10.5.3. Rest of Latin America 
11. Company Profile
  • 11.1. ABB
    • 11.1.1. Company details
    • 11.1.2. Financial outlook
    • 11.1.3. Product summary 
    • 11.1.4. Recent developments
  • 11.2. Accenture
    • 11.2.1. Company details
    • 11.2.2. Financial outlook
    • 11.2.3. Product summary 
    • 11.2.4. Recent developments
  • 11.3. Cisco Systems, Inc.
    • 11.3.1. Company details
    • 11.3.2. Financial outlook
    • 11.3.3. Product summary 
    • 11.3.4. Recent developments
  • 11.4. Honeywell International Inc.
    • 11.4.1. Company details
    • 11.4.2. Financial outlook
    • 11.4.3. Product summary 
    • 11.4.4. Recent developments
  • 11.5. International Business Machines Corporation
    • 11.5.1. Company details
    • 11.5.2. Financial outlook
    • 11.5.3. Product summary 
    • 11.5.4. Recent developments
  • 11.6. Microsoft
    • 11.6.1. Company details
    • 11.6.2. Financial outlook
    • 11.6.3. Product summary 
    • 11.6.4. Recent developments
  • 11.7. Oracle
    • 11.7.1. Company details
    • 11.7.2. Financial outlook
    • 11.7.3.Product summary 
    • 11.7.4. Recent developments
  • 11.8. SAP SE
    • 11.8.1. Company details
    • 11.8.2. Financial outlook
    • 11.8.3. Product summary 
    • 11.8.4. Recent developments
  • 11.9. Schneider Electric
    • 11.9.1. Company details
    • 11.9.2. Financial outlook
    • 11.9.3. Product summary 
    • 11.9.4. Recent developments
  • 11.10. Siemens
    • 11.10.1. Company details
    • 11.10.2. Financial outlook
    • 11.10.3. Product summary 
    • 11.10.4. Recent developments
  • 11.11. Others
12. Conclusion

13. List of Abbreviations

14. Reference Links

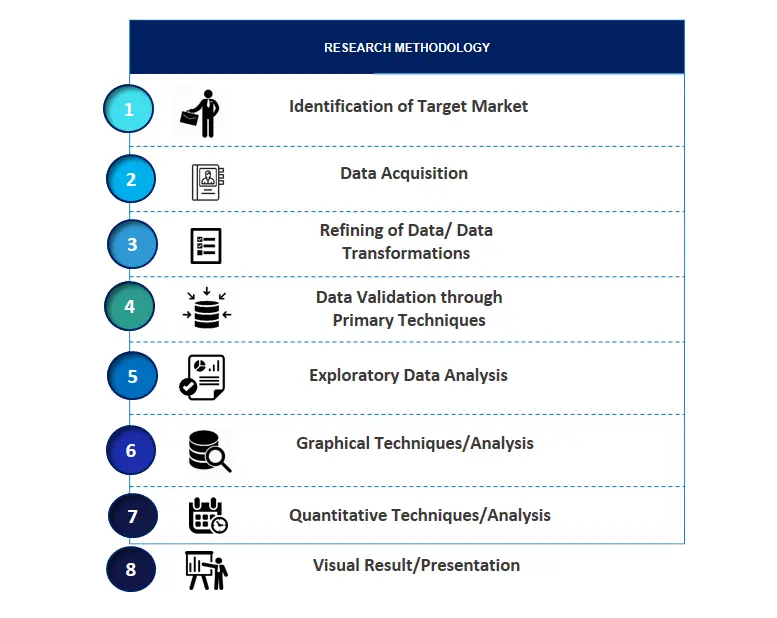
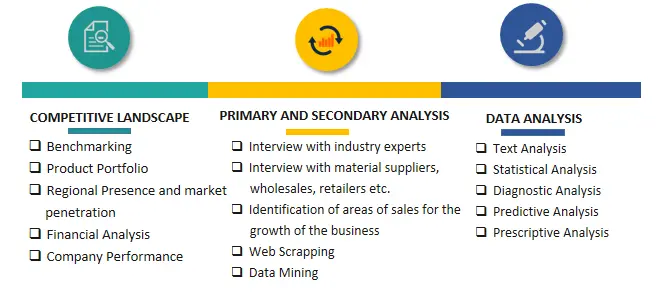
SPER Market Research’s methodology uses great emphasis on primary research to ensure that the market intelligence insights are up to date, reliable and accurate. Primary interviews are done with players involved in each phase of a supply chain to analyze the market forecasting. The secondary research method is used to help you fully understand how the future markets and the spending patterns look likes.

The report is based on in-depth qualitative and quantitative analysis of the Product Market. The quantitative analysis involves the application of various projection and sampling techniques. The qualitative analysis involves primary interviews, surveys, and vendor briefings.  The data gathered as a result of these processes are validated through experts opinion. Our research methodology entails an ideal mixture of primary and secondary initiatives.
SPER-Methodology-1

SPER-Methodology-2

SPER-Methodology-3


Frequently Asked Questions About This Report
Digital Utility Market is projected to reach USD 586.46 billion by 2034, growing at a CAGR of 10.26% during the forecast period.
Digital Utility Market grew in Market size from 2025. The Market is expected to reach USD 586.46 billion by 2034, at a CAGR of 10.26% during the forecast period.
Digital Utility Market CAGR of 10.26% during the forecast period.
You can get the sample pages by clicking the link - Click Here
Digital Utility Market size is USD 586.46 billion from 2025 to 2034.
Digital Utility Market is covered By Technology, By Network
North America is anticipated to have the highest Market share in the Digital Utility Market.
ABB, Accenture, Cisco Systems, Honeywell International, International Business Machines Corporation (IBM), Microsoft, Oracle, SAP SE, Schneider Electric, and Siemens.
The report includes an in-depth analysis of the Global Digital Utility Market, including market size and trends, product mix, Applications, and supplier analysis
PLACE AN ORDER
  • 15 % off
     
    $ 4250
  • 20 % off
             
    $ 5650
  • 25 % off
         
    $ 7450
Pre-Purchase Inquiry
SEND AN INQUIRY
NEED CUSTOMIZATION?
Request Customization
CALL OR EMAIL US
US:
India:
Email:
100% Secure Payment

SPER American Express
SPER VISA
SPER Master Card
SPER Mestro
SPER Paypal
SPER CCAvenues

Have a glance of the Report

  Download Free Sample

Looking for Customization?

 Customization Request

Have a Question?

 Reach Our Analysis Team

COVID-19 impact analysis?

 Request Analysis

Our Global Clients

Our data-driven insights have influenced the strategy of 200+ reputed companies across the globe.

SPER-Astellas Pharma
SPER-Microsoft
SPER-EY
SPER-McKinsey
SPER-Bain
SPER-Max-Healthcare
SPER-DHL
SPER-IQVIA
SPER-Mitsubishi Logistics
SPER-PACCOR
SPER-Macmillan Education
SPER-Kankar IMRB
SPER-ITA
SPER-PWC
SPER-SAPTCA
SPER-Straumann
SPER-MENARINI Silicon Biosystems
SPER-IPSOS
SPER-Heineken