Global Tensiometer Market Size - By Product, By End Use - Regional Outlook, Competitive Strategies and Segment Forecast to 2035

Published: Jul-2026 Report ID: MACH2618 Pages: 1 - 250 Formats*:     
Category : Equipment and Machinery
According to SPER Market Research, the Global Tensiometer Market is estimated to reach USD 252.96 million by 2035 with a CAGR 5.65%.  
Introduction and Overview
The report includes an in-depth analysis of the Global Tensiometer Market, including market size and trends, product mix, Applications, and supplier analysis.

The global Tensiometer Market was valued at USD 146.0 million in 2025 and is expected to reach USD 252.96 million by 2035, registering a CAGR of 5.65% during the forecast period. The global tensiometer market is driven by the increasing demand for accurate measurement and control of surface and interfacial properties across industrial and research applications. Industries including chemicals, cosmetics, pharmaceuticals, and oil & gas depend on precise surface tension analysis to optimize formulations, maintain product quality, and ensure consistent performance. Growing product complexity, stricter quality standards, and expanding research activities are encouraging the adoption of advanced tensiometers. The need for reliable, repeatable, and high-precision measurements in quality control and product development continues to fuel steady growth in the global tensiometer market.


By Product:
Automated force tensiometers lead the market due to their high accuracy, repeatability, and suitability for routine testing in regulated laboratory environments. They are widely used across the chemical, pharmaceutical, and industrial sectors for reliable surface and interfacial tension measurements, while automation improves efficiency and minimizes operator influence. Bubble pressure tensiometers are experiencing strong growth as demand rises for dynamic surface tension analysis in fast-moving applications such as detergents, coatings, inks, and spray formulations. Their ability to capture rapid surface behavior supports formulation development, process optimization, and quality improvement across multiple industries.

By End Use:
The chemical industry leads the tensiometer market due to its extensive use of surface and interfacial measurement technologies in developing and quality testing products such as coatings, paints, detergents, inks, emulsions, and specialty chemicals. Continuous production and frequent formulation changes sustain strong demand for accurate testing. Meanwhile, the pharmaceutical and biopharmaceutical sector is witnessing the fastest growth, driven by increasing formulation complexity, expanding biologics development, and stringent quality standards. Tensiometers play a vital role in evaluating formulation stability, liquid behavior, and excipient interactions while supporting regulatory compliance and reliable product validation.

Regional Insights:
North America is experiencing steady growth, supported by strong demand from the pharmaceutical, medical device, and oil and gas industries, along with ongoing investments in research and automated laboratory technologies. The United States leads the regional market due to its advanced industrial base, high research spending, and widespread adoption of software-integrated tensiometers for quality control and regulatory compliance. Europe also maintains stable growth, driven by precision manufacturing, standardized testing, and research activities. Germany remains the regional leader, while the United Kingdom records strong growth through expanding pharmaceutical, life sciences, and advanced materials research.

Market Competitive Landscape:
The Global Tensiometer Market is highly consolidated Some of the market key players are Apex Instruments Co Pvt. Ltd., AST Products, Inc., Biolin Scientific AB, Brighton Science, ChemInstruments, CSC Scientific Company, DataPhysics Instruments GmbH, First Ten Angstroms, Grace Instrument, Holmarc Opto-Mechatronics Ltd., KRÜSS Scientific GmbH, and LAUDA Scientific GmbH.

Recent Developments:
In February 2025, Biolin Scientific AB launched the Attension Theta Wafer module, a high-precision optical tensiometer for automated contact angle measurements on silicon wafers, enhancing efficiency in semiconductor testing.
In April 2024, DataPhysics Instruments GmbH partnered with droptical to launch the FlexDrop system, enabling precise micro-droplet dosing for advanced contact angle and surface energy analysis on OCA-series instruments.

Scope of the report:
Report Metric Details
Market size available for the years 2022-2035
Base year considered 2025
Forecast Period 2026-2035
Segments Covered By Product, By End Use
Regions Covered North America, Latin America, Asia-Pacific,
Europe, and Middle East & Africa
Companies Covered Apex Instruments Co Pvt. Ltd., AST Products, Inc., Biolin Scientific AB, Brighton Science, ChemInstruments, CSC Scientific Company, DataPhysics Instruments GmbH, First Ten Angstroms, Grace Instrument, Holmarc Opto-Mechatronics Ltd., KRÜSS Scientific GmbH, and LAUDA Scientific GmbH.

Key Topics Covered in the Report
  • Global Tensiometer Market Size (FY’2022-FY’2035)
  • Overview of Global Tensiometer Market
  • Segmentation of Global Tensiometer Market by Product (Portable Contact Angle, Benchtop Contact Angle, Manual/Semi-manual Force Tensiometer, Automated Force Tensiometer, Bubble Pressure Tensiometer, Spinning Drop Tensiometer, Foam Analyzer)
  • Segmentation of Global Tensiometer Market by End Use (Chemical, Oil & Gas, Energy, Pharmaceutical & Biopharmaceutical, Medical Device, Cosmetic, Academic & Research, Others)
  • Statistical Snap of Global Tensiometer Market
  • Expansion Analysis of Global Tensiometer Market
  • Problems and Obstacles in Global Tensiometer Market 
  • Competitive Landscape in the Global Tensiometer Market
  • Details on Current Investment in Global Tensiometer Market
  • Competitive Analysis of Global Tensiometer Market 
  • Prominent Players in the Global Tensiometer Market
  • SWOT Analysis of Global Tensiometer Market  
  • Global Tensiometer Market Future Outlook and Projections (FY’2026-FY’2035) 
  • Recommendations from Analyst

1. Introduction
1.1 Scope of the report
1.2  Market segment analysis

2. Research Methodology 
2.1 Research data source
2.1.1 Secondary Data
2.1.2 Primary Data
2.1.3 SPER’s internal Database
2.1.4 Primary insight from KOL’s
2.2 Market size estimation
2.2.1 Top-down and Bottom-up approach
2.3 Data triangulation

3. Executive Summary

4. Market Dynamics
4.1 Driver, Restraint, Opportunity and Challenges analysis
4.1.1 Drivers
4.1.2 Restraints
4.1.3 Opportunities
4.1.4 Challenges

5. Market variable and outlook
5.1 SWOT Analysis
5.1.1 Strengths
5.1.2 Weaknesses
5.1.3 Opportunities
5.1.4 Threats
5.2 PESTEL Analysis
5.2.1 Political Landscape
5.2.2 Economic Landscape
5.2.3 Social Landscape
5.2.4 Technological Landscape
5.2.5 Environmental Landscape
5.2.6 Legal Landscape
5.3 PORTER’s Five Forces
5.4 Heat Map Analysis

6. Competitive Landscape
6.1. Global Tensiometer Market Manufacturing Base Distribution, Sales Area, Product Type
6.2 Mergers & Acquisitions, Partnerships, Product Launch, and Collaboration in Global Tensiometer Market

7. Global Tensiometer Market, By Product, (USD Million) 2022-2035
7.1 Portable Contact Angle
7.2 Benchtop Contact Angle
7.3 Manual/Semi-manual Force Tensiometer
7.4 Automated Force Tensiometer
7.5 Bubble Pressure Tensiometer
7.6 Spinning Drop Tensiometer
7.7 Foam Analyzer

8. Global Tensiometer Market, By End Use, (USD Million) 2022-2035
8.1 Chemical
8.2 Oil & Gas
8.3 Energy
8.4 Pharmaceutical & Biopharmaceutical
8.5 Medical Device
8.6 Cosmetic
8.7 Academic & Research
8.8 Others

9. Global Tensiometer Market, By End Use, (USD Million) 2022-2035
9.1 Pharmaceutical & Biotechnology Companies
9.2 Academic & Research Institutes
9.3 Hospitals & Clinical Laboratories
9.4 Others

10. Global Tensiometer Market, (USD Million) 2022-2035   
10.1 Global Tensiometer Market Size and Market Share

11.  Global Tensiometer Market, By Region, (USD Million) 2022-2035 
11.1 Asia-Pacific
11.1.1 Australia
11.1.2 China
11.1.3 India
11.1.4 Japan
11.1.5 South Korea
11.1.6 Rest of Asia-Pacific
11.2 Europe
11.2.1 France
11.2.2 Germany 
11.2.3 Italy
11.2.4 Spain
11.2.5 United Kingdom
11.2.6 Rest of Europe
11.3 Middle East and Africa
11.3.1 Kingdom of Saudi Arabia
11.3.2 United Arab Emirates
11.3.3 Qatar
11.3.4 South Africa
11.3.5 Egypt
11.3.6 Morocco
11.3.7 Nigeria
11.3.8 Rest of Middle-East and Africa
11.4 North America
11.4.1 Canada 
11.4.2 Mexico
11.4.3 United States
11.5 Latin America
11.5.1 Argentina
11.5.2 Brazil
11.5.3 Rest of America

12. Company Profile
12.1 Apex Instruments Co Pvt. Ltd.
12.1.1 Company details
12.1.2 Financial outlook
12.1.3 Product summary
12.1.4 Recent developments
12.2 AST Products, Inc.
12.2.1 Company details
12.2.2 Financial outlook
12.2.3 Product summary
12.2.4 Recent developments
12.3 Biolin Scientific AB
12.3.1 Company details
12.3.2 Financial outlook
12.3.3 Product summary
12.3.4 Recent developments
12.4 Brighton Science
12.4.1 Company details
12.4.2 Financial outlook
12.4.3 Product summary
12.4.4 Recent developments
12.5 ChemInstruments
12.5.1 Company details
12.5.2 Financial outlook
12.5.3 Product summary
12.5.4 Recent developments
12.6 CSC Scientific Company
12.6.1 Company details
12.6.2 Financial outlook
12.6.3 Product summary
12.6.4 Recent developments
12.7 DataPhysics Instruments GmbH
12.7.1 Company details
12.7.2 Financial outlook
12.7.3 Product summary
12.7.4 Recent developments
12.8 First Ten Angstroms
12.8.1 Company details
12.8.2 Financial outlook
12.8.3 Product summary
12.8.4 Recent developments
12.9 Grace Instrument
12.9.1  Company details
12.9.2  Financial outlook
12.9.3  Product summary
12.9.4  Recent developments
12.10 Holmarc Opto-Mechatronics Ltd.
12.10.1  Company details
12.10.2  Financial outlook
12.10.3  Product summary
12.10.4  Recent developments
12.11 KRÜSS Scientific GmbH
12.11.1  Company details
12.11.2  Financial outlook
12.11.3  Product summary
12.11.4  Recent developments
12.12 LAUDA Scientific GmbH
12.12.1  Company details
12.12.2  Financial outlook
12.12.3  Product summary
12.12.4  Recent developments
12.13 Others

13. Conclusion

14. List Of Abbreviations

15. Reference Links


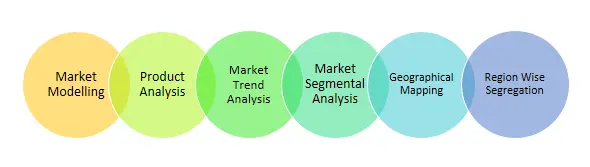
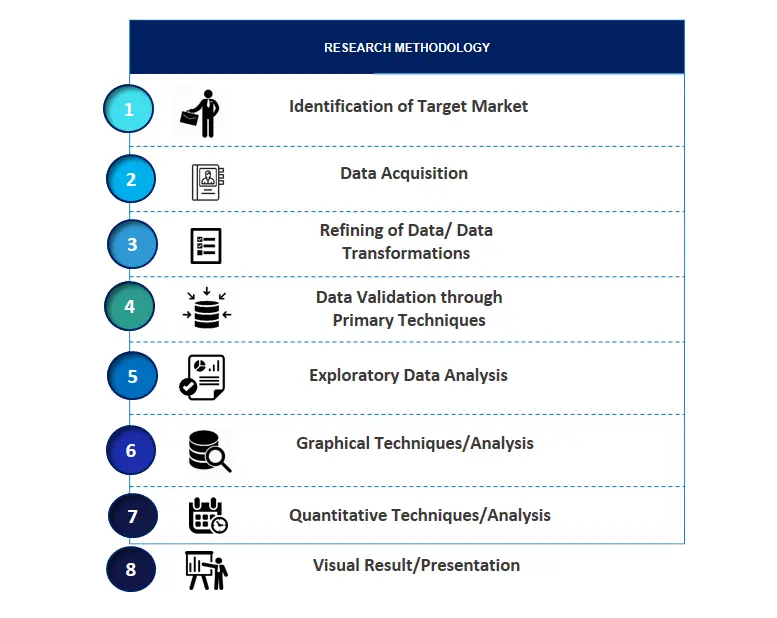
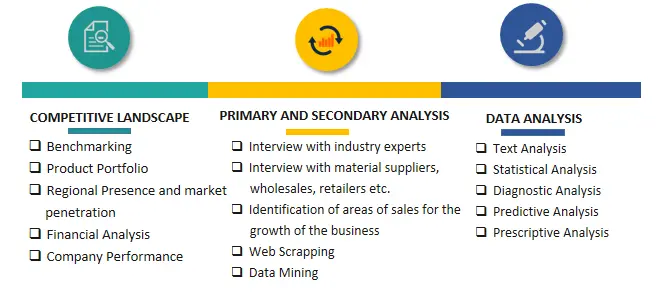
SPER Market Research’s methodology uses great emphasis on primary research to ensure that the market intelligence insights are up to date, reliable and accurate. Primary interviews are done with players involved in each phase of a supply chain to analyze the market forecasting. The secondary research method is used to help you fully understand how the future markets and the spending patterns look likes.

The report is based on in-depth qualitative and quantitative analysis of the Product Market. The quantitative analysis involves the application of various projection and sampling techniques. The qualitative analysis involves primary interviews, surveys, and vendor briefings.  The data gathered as a result of these processes are validated through experts opinion. Our research methodology entails an ideal mixture of primary and secondary initiatives.
SPER-Methodology-1

SPER-Methodology-2

SPER-Methodology-3


Frequently Asked Questions About This Report
PLACE AN ORDER
  • 15 % off
     
    $ 3250
  • 20 % off
             
    $ 4250
  • 25 % off
         
    $ 6250
Pre-Purchase Inquiry
SEND AN INQUIRY
NEED CUSTOMIZATION?
Request Customization
CALL OR EMAIL US
US:
India:
Email:
100% Secure Payment

SPER American Express
SPER VISA
SPER Master Card
SPER Mestro
SPER Paypal
SPER CCAvenues

Have a glance of the Report

  Download Free Sample

Looking for Customization?

 Customization Request

Have a Question?

 Reach Our Analysis Team

COVID-19 impact analysis?

 Request Analysis
Thought Leadership

Trusted by Industry Leaders

Our data-driven insights have influenced the strategy of 200+ reputed companies across the globe.

SPER-Astellas Pharma
SPER-Microsoft
SPER-EY
SPER-McKinsey
SPER-Bain
SPER-Max-Healthcare
SPER-DHL
SPER-IQVIA
SPER-Mitsubishi Logistics
SPER-PACCOR
SPER-Macmillan Education
SPER-Kankar IMRB
SPER-ITA
SPER-PWC
SPER-SAPTCA
SPER-Straumann
SPER-Danaher
SPER-AandM
SPER-MENARINI Silicon Biosystems
SPER-IPSOS
SPER-Heineken
HIPPA Compliant
GDPR Certified
ISO 27001
Peer Reviewed
Get Started Today

Your Competitive Advantage in
Pharmaceutical & Medical Technology
Markets

Join industry leaders leveraging AI-powered intelligence to make confident, data-driven decisions that accelerate breakthrough treatments and technologies to market.

No Credit Card Required
15-Minute Demo
Expert Guidance