Interactive Tables Market Growth, Trends and Share Analysis 2034

Global Interactive Tables Market Growth, Size, Trends Analysis - By Technology, By Screen Size, By Application - Regional Outlook, Competitive Strategies and Segment Forecast to 2034

Published: Jul-2025 Report ID: SEMI2542 Pages: 1 - 250 Formats*:     
Category : Semiconductor and Electronics
Global Interactive Tables Market Introduction and Overview

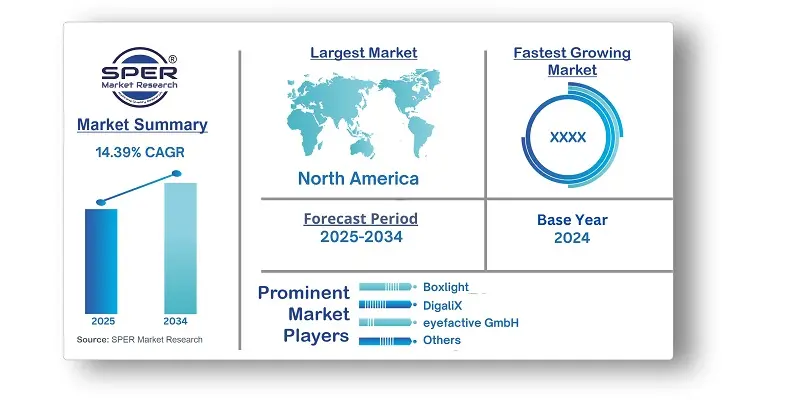
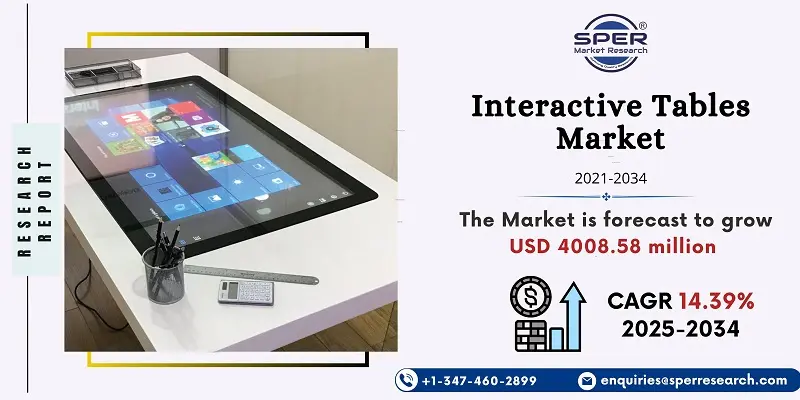
According to SPER Market Research, the Global Interactive Tables Market is estimated to reach USD 4008.58 million by 2034 with a CAGR of 14.39%.

The report includes an in-depth analysis of the Global Interactive Tables Market, including market size and trends, product mix, Applications, and supplier analysis. The Interactive Tables Market was valued at USD 1123.31 million in 2024 and is expected to grow at a CAGR of 14.39% from 2025 to 2034. The market is expanding due to technological developments in display technology. The quality and responsiveness of interactive displays have been improved by advancements in LCD and LED technology, increasing their appeal to consumers and companies alike. Navigation has been smoother and more natural since the advent of capacitive touch technology, which has enhanced user involvement. One example of this is the Microsoft Surface Hub, which facilitates smooth collaboration in meeting rooms by utilizing cutting-edge touch display technology.
By Technology Insights
In 2024, the capacitive category held a dominant revenue share in the worldwide interactive tables market. The precision, quickness, and simultaneous detection of touch input with several fingers are well-known features of capacitive touchscreens. Because of these characteristics, they are the perfect technology for interactive tables in a variety of use cases, including public information systems, retail, education, business meetings, and entertainment. due to its great sensitivity and perfect touch recognition, capacitive touchscreens provide accurate and seamless interactions. 

By Screen Size Insights
In 2024, the 32–65-inch market dominated the global interactive table market in terms of revenue share. These displays are far more portable than video wall touchscreen displays due to their lower size, which allows them to be readily disconnected and transported to various locations. The smaller variants in this line are frequently utilized in retail settings for displaying promotional materials or digital product catalogs, as well as in small places like personal offices.

By Application Insights
In 2024, the education sector held the most revenue share in the global market, and it is anticipated to continue to hold this position in the years to come. Interactive tables are now a crucial component of educational institutions' efforts to improve student engagement, foster collaboration, and enhance the learning process. Students and teachers may engage with content more actively because to these tables' combination of touch technologies and digital displays. Leading international institutions' increased emphasis on STEM education has given this industry a lot of room to develop.


Regional Insights
The North American market for interactive tables held the most revenue share worldwide, due to growing awareness of this technology across a range of industries. The education industry has been concentrating on using various technologies to increase student engagement in class activities and comprehension of a range of subjects. Also, market participants creating cutting-edge display solutions now have more development prospects because to the retail sector's explosive expansion in regional economies like the US and Canada. To assure greater customer interaction, retailers utilize these technologies for virtual try-ons, interactive ads, and product catalogs.

Market Competitive Landscape
The Interactive Tables market is dominated by established players such as well as Boxlight, DigaliX, eyefactive GmbH, Garamantis GmbH, Ideum, a number of small and medium-sized companies. These market participants give high priority on innovation and customization to satisfy the changing demands of many industries, including corporate settings, retail, hospitality, and education. To increase multi-touch responsiveness, advance user interface technologies, and incorporate AI and IoT for more intelligent interactions, businesses are spending more money on research and development. 

Recent Developments:

In September 2024, Ideum partnered with Clark Planetarium to showcase its latest interactive table technology at the ASTC Conference in Chicago. The company displayed its 65-inch Platform II model, along with a prototype OLED version, both running software developed by Clark. These systems were designed to work in sync with Ideum’s existing range of touch tables and kiosks. Among the featured interactive experiences were Gravity Lab, Stellar Playground, and Colonize Mars, aimed at providing immersive and educational content for users.
In July 2024, The CIFP Carlos Oroza, a school that provides vocational training in the hospitality industry, received DigaliX's SIMMERSIVE Interactive Tasting Classroom solution. With the use of cutting-edge technology, the interactive classroom offers dynamic and thorough instruction, allowing students to increase their skills and understanding. These consist of virtual surroundings and virtual winery solutions, as well as the interactive tables known as "XTable," which let students practice and hone their skills through interactive tasting activities using specially designed software.

Scope of the report:
 Report Metric Details
 Market size available for years2021-2034
 Base year considered2024
 Forecast period2025-2034
 Segments coveredBy Technology, By Screen Size, By Application
 Regions coveredNorth America, Latin America, Asia-Pacific, Europe, and Middle East & Africa
 Companies Covered
Boxlight, DigaliX, eyefactive GmbH, Garamantis GmbH, Ideum, Intermedia Touch, MARVEL TECHNOLOGY (CHINA) CO., LTD, MMT GmbH & Co. KG, Pro Display, TableConnect GmbH

Key Topics Covered in the Report
  • Global Interactive Tables Market Size (FY’2021-FY’2034)
  • Overview of Global Interactive Tables Market
  • Segmentation of Global Interactive Tables Market by Technology (LCD, LED, Capacitive, Others)
  • Segmentation of Global Interactive Tables Market by Screen Size (32-65 Inch, 65 Inch & Above)
  • Segmentation of Global Interactive Tables Market by Application (Exhibitions & Trade Shows, Education, Hospitality, Retail, Control Room, Transportation, Others)
  • Statistical Snap of Global Interactive Tables Market
  • Expansion Analysis of Global Interactive Tables Market
  • Problems and Obstacles in Global Interactive Tables Market
  • Competitive Landscape in the Global Interactive Tables Market
  • Details on Current Investment in Global Interactive Tables Market
  • Competitive Analysis of Global Interactive Tables Market
  • Prominent Players in the Global Interactive Tables Market
  • SWOT Analysis of Global Interactive Tables Market
  • Global Interactive Tables Market Future Outlook and Projections (FY’2025-FY’2034)
  • Recommendations from Analyst
1.Introduction
1.1.Scope of the report
1.2.Market segment analysis

2.Research Methodology
2.1.Research data source
2.1.1.Secondary Data
2.1.2.Primary Data
2.1.3.SPERs internal database
2.1.4.Premium insight from KOLs
2.2.Market size estimation
2.2.1.Top-down and Bottom-up approach
2.3.Data triangulation

3.Executive Summary

4.Market Dynamics
4.1.Driver, Restraint, Opportunity and Challenges analysis
4.1.1.Drivers
4.1.2.Restraints
4.1.3.Opportunities
4.1.4.Challenges

5.Market variable and outlook
5.1.SWOT Analysis
5.1.1.Strengths
5.1.2.Weaknesses
5.1.3.Opportunities
5.1.4.Threats
5.2.PESTEL Analysis
5.2.1.Political Landscape
5.2.2.Economic Landscape
5.2.3.Social Landscape
5.2.4.Technological Landscape
5.2.5.Environmental Landscape
5.2.6.Legal Landscape
5.3.PORTERs Five Forces 
5.3.1.Bargaining power of suppliers
5.3.2.Bargaining power of buyers
5.3.3.Threat of Substitute
5.3.4.Threat of new entrant
5.3.5.Competitive rivalry
5.4.Heat Map Analysis

6.Competitive Landscape
6.1.Global Interactive Tables Market Manufacturing Base Distribution, Sales Area, Product Type 
6.2.Mergers & Acquisitions, Partnerships, Product Launch, and Collaboration in Global Interactive Tables Market

7.Global Interactive Tables Market, By Technology (USD Million) 2021-2034
7.1.LCD
7.2.LED
7.3.Capacitive
7.4.Others

8.Global Interactive Tables Market, By Screen-Size (USD Million) 2021-2034
8.1.32-65 Inch
8.2.65 Inch & Above

9.Global Interactive Tables Market, By Application (USD Million) 2021-2034
9.1.Exhibitions & Trade Shows
9.2.Education
9.3.Hospitality
9.4.Retail
9.5.Control Room
9.6.Transportation
9.7.Others

10.Global Interactive Tables Market, (USD Million) 2021-2034
10.1.Global Interactive Tables Market Size and Market Share

11.Global Interactive Tables Market, By Region, (USD Million) 2021-2034
11.1.Asia-Pacific
11.1.1.Australia
11.1.2.China
11.1.3.India
11.1.4.Japan
11.1.5.South Korea
11.1.6.Rest of Asia-Pacific
11.2.Europe
11.2.1.France
11.2.2.Germany
11.2.3.Italy
11.2.4.Spain
11.2.5.United Kingdom
11.2.6.Rest of Europe
11.3.Middle East and Africa
11.3.1.Kingdom of Saudi Arabia 
11.3.2.United Arab Emirates
11.3.3.Qatar
11.3.4.South Africa
11.3.5.Egypt
11.3.6.Morocco
11.3.7.Nigeria
11.3.8.Rest of Middle-East and Africa
11.4.North America
11.4.1.Canada
11.4.2.Mexico
11.4.3.United States
11.5.Latin America
11.5.1.Argentina
11.5.2.Brazil
11.5.3.Rest of Latin America 

12.Company Profile
12.1.Boxlight
12.1.1.Company details
12.1.2.Financial outlook
12.1.3.Product summary 
12.1.4.Recent developments
12.2.DigaliX
12.2.1.Company details
12.2.2.Financial outlook
12.2.3.Product summary 
12.2.4.Recent developments
12.3.eyefactive GmbH
12.3.1.Company details
12.3.2.Financial outlook
12.3.3.Product summary 
12.3.4.Recent developments
12.4.Garamantis GmbH
12.4.1.Company details
12.4.2.Financial outlook
12.4.3.Product summary 
12.4.4.Recent developments
12.5.Ideum
12.5.1.Company details
12.5.2.Financial outlook
12.5.3.Product summary 
12.5.4.Recent developments
12.6.Intermedia Touch
12.6.1.Company details
12.6.2.Financial outlook
12.6.3.Product summary 
12.6.4.Recent developments
12.7.MARVEL TECHNOLOGY (CHINA) CO., LTD
12.7.1.Company details
12.7.2.Financial outlook
12.7.3.Product summary 
12.7.4.Recent developments
12.8.TableConnect GmbH
12.8.1.Company details
12.8.2.Financial outlook
12.8.3.Product summary 
12.8.4.Recent developments
12.9.MMT GmbH & Co. KG
12.9.1.Company details
12.9.2.Financial outlook
12.9.3.Product summary 
12.9.4.Recent developments
12.10.Pro Display
12.10.1.Company details
12.10.2.Financial outlook
12.10.3.Product summary 
12.10.4.Recent developments
12.11.Others

13.Conclusion

14.List of Abbreviations

15.Reference Links

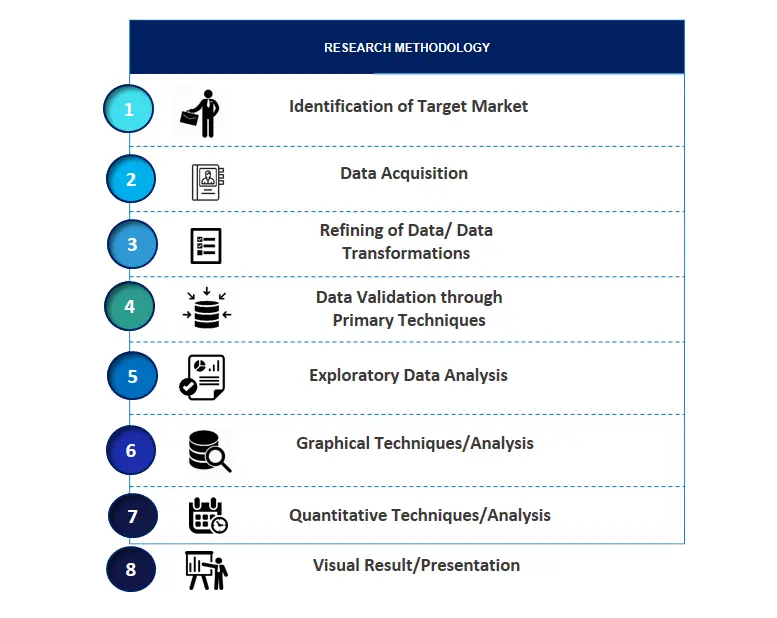
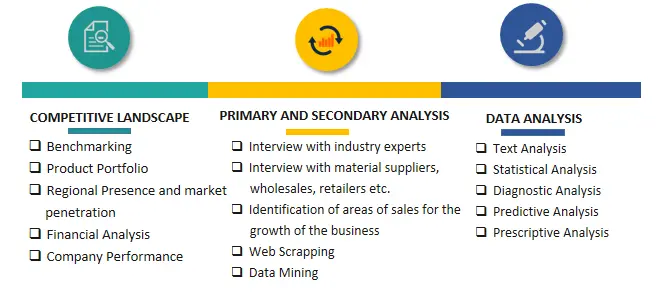
SPER Market Research’s methodology uses great emphasis on primary research to ensure that the market intelligence insights are up to date, reliable and accurate. Primary interviews are done with players involved in each phase of a supply chain to analyze the market forecasting. The secondary research method is used to help you fully understand how the future markets and the spending patterns look likes.

The report is based on in-depth qualitative and quantitative analysis of the Product Market. The quantitative analysis involves the application of various projection and sampling techniques. The qualitative analysis involves primary interviews, surveys, and vendor briefings.  The data gathered as a result of these processes are validated through experts opinion. Our research methodology entails an ideal mixture of primary and secondary initiatives.
SPER-Methodology-1

SPER-Methodology-2

SPER-Methodology-3


Frequently Asked Questions About This Report
Interactive Tables Market is projected to reach USD 4008.58 million by 2034, growing at a CAGR of of 14.39% during the forecast period.
Interactive Tables Market grew in Market size from 2025. The Market is expected to reach USD 4008.58 million by 2034, at a CAGR of 14.39% during the forecast period.
Interactive Tables Market CAGR of 14.39% during the forecast period.
You can get the sample pages by clicking the link - Click Here
Interactive Tables Market size is USD 4008.58 million from 2025 to 2034.
Interactive Tables Market is covered By Technology, By Screen Size, By Application
The North America is anticipated to have the highest Market share in the Interactive Tables Market.
Boxlight, DigaliX, eyefactive GmbH, Garamantis GmbH, Ideum, Intermedia Touch, MARVEL TECHNOLOGY (CHINA) CO., LTD, MMT GmbH & Co. KG, Pro Display, TableConnect GmbH
The report includes an in-depth analysis of the Global Interactive Tables Market, including market size and trends, product mix, Applications, and supplier analysis.
PLACE AN ORDER
  • 15 % off
     
    $ 4250
  • 20 % off
             
    $ 5650
  • 25 % off
         
    $ 7450
Pre-Purchase Inquiry
SEND AN INQUIRY
NEED CUSTOMIZATION?
Request Customization
CALL OR EMAIL US
US:
India:
Email:
100% Secure Payment

SPER American Express
SPER VISA
SPER Master Card
SPER Mestro
SPER Paypal
SPER CCAvenues

Have a glance of the Report

  Download Free Sample

Looking for Customization?

 Customization Request

Have a Question?

 Reach Our Analysis Team

COVID-19 impact analysis?

 Request Analysis

Our Global Clients

Our data-driven insights have influenced the strategy of 200+ reputed companies across the globe.

SPER-Astellas Pharma
SPER-Microsoft
SPER-EY
SPER-McKinsey
SPER-Bain
SPER-Max-Healthcare
SPER-DHL
SPER-IQVIA
SPER-Mitsubishi Logistics
SPER-PACCOR
SPER-Macmillan Education
SPER-Kankar IMRB
SPER-ITA
SPER-PWC
SPER-SAPTCA
SPER-Straumann
SPER-MENARINI Silicon Biosystems
SPER-IPSOS
SPER-Heineken