Power Generation Carbon Capture & Storage Market Introduction and Overview
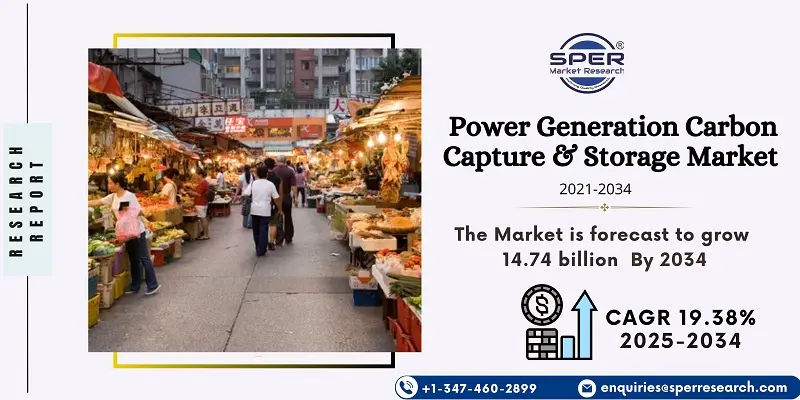
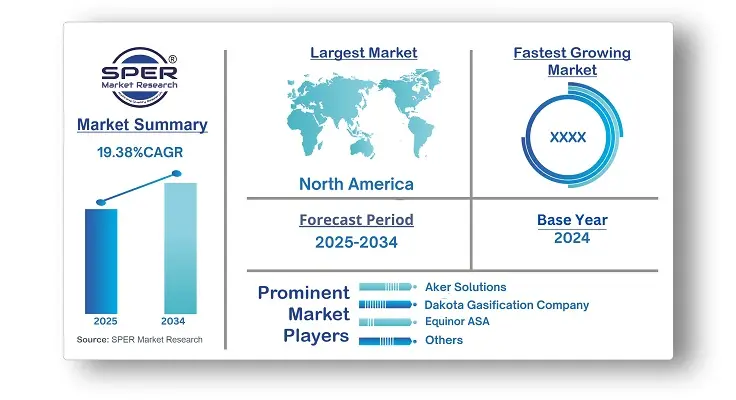
According to SPER Market Research, the Global Power Generation Carbon Capture & Storage Market is estimated to reach USD 14.74 billion by 2034 with a CAGR of 19.38%.
The report includes an in-depth analysis of the Global Power Generation Carbon Capture & Storage Market, including market size and trends, Interface mix, Applications, and supplier analysis. Power generation carbon capture and storage (CCS) is a technology designed to reduce carbon dioxide (CO₂) emissions from fossil fuel-based power plants by capturing, transporting, and securely storing CO₂ underground. This process helps mitigate the environmental impact of power generation while supporting the transition to cleaner energy sources. The market for CCS in power generation is growing due to increasing regulatory pressure on carbon emissions, government incentives for carbon reduction, and the rising adoption of sustainable energy practices. However, challenges such as high implementation costs, energy-intensive capture processes, and the need for extensive infrastructure for CO₂ transportation and storage hinder widespread adoption. Additionally, public concerns over storage safety and long-term effectiveness remain barriers to large-scale deployment.
By Technology Insights
The pre-combustion technology had the biggest revenue share. Nowadays, pre-combustion CO2 is captured using the water-gas shift reaction (WGSR) and removed using the acid gas removal (AGR) method in commercial settings all over the world. However, the significant amount of nitrogen in combustion air is the main barrier to removing carbon dioxide from the environment. The integrated gasification combined cycle (IGCC) is the method used to address this issue.
By Application Insights
The power generation segment led the pack. Carbon dioxide emissions increased by about two-thirds in 2022 compared to 2021 due to the worldwide power sector. The application of carbon capture and storage technology in coal-fired power stations has enormous potential because of the high rates of greenhouse gas emissions. In the upcoming years, this is expected to result in the market's power generation segment expanding.
By Regional Insights
In 2024, the North American region held a global share. The United States leads the world in CCS technology implementation and controls the majority of the region. In 1978, Searles Valley Minerals began the world's first CCS project in a coal-based power plant in the U.S. state of California.
Market Competitive Landscape
The market for Power Generation Carbon Capture & Storage is very competitive. Oil and gas majors are investing in CCS to align with decarbonization strategies, leveraging their expertise in subsurface technologies. Collaborations between industry and governments are common to share risks and costs associated with large-scale CCS projects. Some of the prominent players in Global Power Generation Carbon Capture & Storage Market are Aker Solutions, Dakota Gasification Company, Equinor ASA, Fluor Corporation, Japan CCS Co. Ltd, Linde plc, Mitsubishi Heavy Industries Ltd. (MHI), Shell PLC, Siemens Energy, Sulzer Ltd.
Recent Developments:
In February 2024: Carbfix hf. has announced the extension of its global reach by establishing a new carbon capture plant in Iceland. This plant is expected to collect 3,000 tons of carbon per year.
In June 2023: Technip Energies N.V. has announced the debut of CaptureNow, a platform that integrates all carbon capture, storage, and use technologies into one.
In June 2023: CHN ENERGY Investment Group Co., LTD. has announced the launch of Asia's largest carbon capture project in China. This project is estimated to emit 500,000 tons of CO2 yearly.
Scope of the report:
| Report Metric | Details |
| Market size available for years | 2021-2034 |
| Base year considered | 2024 |
| Forecast period | 2025-2034 |
| Segments covered | By Technology, By Application |
| Regions covered | North America, Latin America, Asia-Pacific, Europe, and Middle East & Africa |
| Companies Covered | Aker Solutions, Dakota Gasification Company, Equinor ASA, Fluor Corporation, Japan CCS Co. Ltd, Linde plc, Mitsubishi Heavy Industries Ltd. (MHI), Shell PLC, Siemens Energy, Sulzer Ltd.
|
Key Topics Covered in the Report
- Global Power Generation Carbon Capture & Storage Market Size (FY’2025-FY’2034)
- Overview of Global Power Generation Carbon Capture & Storage Market
- Segmentation of Global Power Generation Carbon Capture & Storage Market By Technology (Post-combustion, Industrial Process, Pre-combustion and Oxy-combustion)
- Segmentation of Global Power Generation Carbon Capture & Storage Market By Application (Power Generation, Oil & Gas, Metal Production, Cement and Others)
- Statistical Snap of Global Power Generation Carbon Capture & Storage Market
- Expansion Analysis of Global Power Generation Carbon Capture & Storage Market
- Problems and Obstacles in Global Power Generation Carbon Capture & Storage Market
- Competitive Landscape in the Global Power Generation Carbon Capture & Storage Market
- Details on Current Investment in Global Power Generation Carbon Capture & Storage Market
- Competitive Analysis of Global Power Generation Carbon Capture & Storage Market
- Prominent Players in the Global Power Generation Carbon Capture & Storage Market
- SWOT Analysis of Global Power Generation Carbon Capture & Storage Market
- Global Power Generation Carbon Capture & Storage Market Future Outlook and Projections (FY’2025-FY’2034)
- Recommendations from Analyst
1. Introduction
1.1. Scope of the report
1.2. Market segment analysis
2. Research Methodology
2.1. Research data source
2.1.1. Secondary Data
2.1.2. Primary Data
2.1.3. SPER’s internal database
2.1.4. Premium insight from KOL’s
2.2. Market size estimation
2.2.1. Top-down and Bottom-up approach
2.3. Data triangulation
3. Executive Summary
4. Market Dynamics
4.1. Driver, Restraint, Opportunity and Challenges analysis
4.1.1. Drivers
4.1.2. Restraints
4.1.3. Opportunities
4.1.4. Challenges
5. Market variable and outlook
5.1. SWOT Analysis
5.1.1. Strengths
5.1.2. Weaknesses
5.1.3. Opportunities
5.1.4. Threats
5.2. PESTEL Analysis
5.2.1. Political Landscape
5.2.2. Economic Landscape
5.2.3. Social Landscape
5.2.4. Technological Landscape
5.2.5. Environmental Landscape
5.2.6. Legal Landscape
5.3. PORTER’s Five Forces
5.3.1. Bargaining power of suppliers
5.3.2. Bargaining power of buyers
5.3.3. Threat of Substitute
5.3.4. Threat of new entrant
5.3.5. Competitive rivalry
5.4. Heat Map Analysis
6. Competitive Landscape
6.1. Global Power Generation Carbon Capture & Storage Market Manufacturing Base Distribution, Sales Area, Interface Type
6.2. Mergers & Acquisitions, Partnerships, Interface Launch, and Collaboration in Global Power Generation Carbon Capture & Storage Market
7. Global Power Generation Carbon Capture & Storage Market, By Technology 2021-2034 (USD Million)
7.1. Post-combustion
7.2. Industrial Process
7.3. Pre-combustion
7.4. Oxy-Combustion
8. Global Power Generation Carbon Capture & Storage Market, By Application 2021-2034 (USD Million)
8.1. Power generation
8.2. Oil & Gas
8.3. Metal production
8.4. Cement
8.5. Others
9. Global Power Generation Carbon Capture & Storage Market Forecast, 2021-2034 (USD Million)
9.1. Global Power Generation Carbon Capture & Storage Market Size and Market Share
10. Global Power Generation Carbon Capture & Storage Market, By Region, 2021-2034 (USD Million)
10.1. Asia-Pacific
10.1.1. Australia
10.1.2. China
10.1.3. India
10.1.4. Japan
10.1.5. South Korea
10.1.6. Rest of Asia-Pacific
10.2. Europe
10.2.1. France
10.2.2. Germany
10.2.3. Italy
10.2.4. Spain
10.2.5. United Kingdom
10.2.6. Rest of Europe
10.3. Middle East and Africa
10.3.1. Kingdom of Saudi Arabia
10.3.2. United Arab Emirates
10.3.3. Qatar
10.3.4. South Africa
10.3.5. Egypt
10.3.6. Morocco
10.3.7. Nigeria
10.3.8. Rest of Middle-East and Africa
10.4. North America
10.4.1. Canada
10.4.2. Mexico
10.4.3. United States
10.5. Latin America
10.5.1. Argentina
10.5.2. Brazil
10.5.3. Rest of Latin America
11. Company Profile
11.1. Aker Solutions
11.1.1. Company details
11.1.2. Financial outlook
11.1.3. Interface summary
11.1.4. Recent developments
11.2. Dakota Gasification Company
11.2.1. Company details
11.2.2. Financial outlook
11.2.3. Interface summary
11.2.4. Recent developments
11.3. Equinor ASA
11.3.1. Company details
11.3.2. Financial outlook
11.3.3. Interface summary
11.3.4. Recent developments
11.4. Fluor Corporation
11.4.1. Company details
11.4.2. Financial outlook
11.4.3. Interface summary
11.4.4. Recent developments
11.5. Japan CSS Co. Ltd.
11.5.1. Company details
11.5.2. Financial outlook
11.5.3. Interface summary
11.5.4. Recent developments
11.6. Linde Plc
11.6.1. Company details
11.6.2. Financial outlook
11.6.3. Interface summary
11.6.4. Recent developments
11.7. Mitsubishi Heavy Industries Ltd.
11.7.1. Company details
11.7.2. Financial outlook
11.7.3. Interface summary
11.7.4. Recent developments
11.8. Shell Plc
11.8.1. Company details
11.8.2. Financial outlook
11.8.3. Interface summary
11.8.4. Recent developments
11.9. Siemens Energy
11.9.1. Company details
11.9.2. Financial outlook
11.9.3. Interface summary
11.9.4. Recent developments
11.10. Sulzer Ltd.
11.10.1. Company details
11.10.2. Financial outlook
11.10.3. Interface summary
11.10.4. Recent developments
12. Conclusion
13. List of Abbreviations
14. Reference Links