Virtual Pipeline Systems Market Growth, Size, Trends, Revenue, Challenges and Future Competition
Virtual Pipeline Systems Market Size- By Type, By Gas, By Pressure, By Application- Regional Outlook, Competitive Strategies and Segment Forecast to 2033
| Published: Jul-2023 | Report ID: COAM2324 | Pages: 1 - 224 | Formats*: |
| Category : Construction & Manufacturing | |||
- Energy Demand in Remote places: Virtual pipeline systems are especially beneficial for delivering energy to remote or isolated places where traditional pipeline construction is difficult or economically unviable. Islands, mountainous regions, and rural villages are examples of these environments. The increasing energy demand in these areas necessitates the use of alternative transportation techniques such as virtual pipelines.
- Industrial and commercial applications: Virtual pipeline systems are widely used in a variety of industries and business sectors. They provide natural gas for power generation, manufacturing processes, heating and cooling systems, and so on. As industries and commercial activities expand, so does the demand for virtual pipeline systems as an effective energy supply option.

| Report Metric | Details |
| Market size available for years | 2019-2033 |
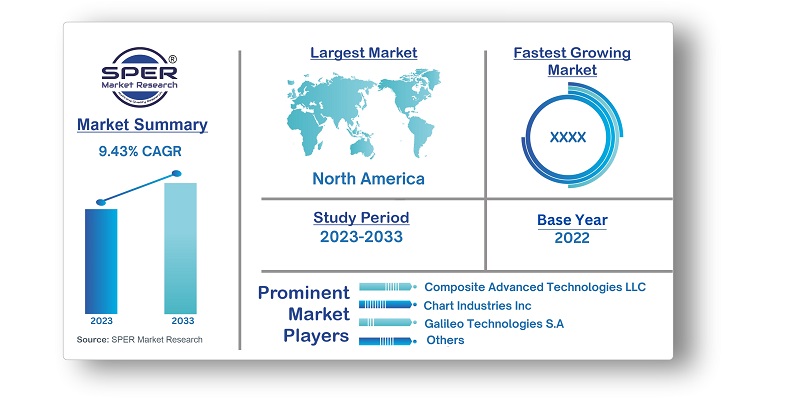
| Base year considered | 2022 |
| Forecast period | 2023-2033 |
| Segments covered | By Type, By Gas, By Pressure, By Application. |
| Regions covered | Asia Pacific, Europe, Middle East and Africa, North America, Latin America |
| Companies Covered | Composite Advanced Technologies LLC, Chart Industries Inc, CNG Services Ltd, Fiba Technologies Inc, Galileo Technologies S.A, Hexagon Agility, SHIJIAZHUANG ENRIC GAS Equipment Co, Quantum Fuel Systems LLC, RAG Austria AG, Others |
- Natural Gas Suppliers
- Industrial and Commercial Users
- Remote and Off-grid Locations
- Energy Utilities
- Renewable Energy Integration
| By Type: |
|
| By Gas : |
|
| By Pressure : |
|
| By Application: |
|
- Global Virtual Pipeline Systems Market Size (FY’2023-FY’2033)
- Overview of Global Virtual Pipeline Systems Market
- Segmentation of Global Virtual Pipeline Systems Market By Type (Standard, Towable)
- Segmentation of Global Virtual Pipeline Systems Market By Gas (CNG, Hydrogen, Others)
- Segmentation of Global Virtual Pipeline Systems Market By Pressure (Less than 3000 Psi, 3001 to 5000 Psi, More than 5000 Psi)
- Segmentation of Global Virtual Pipeline Systems Market By Application (Industrial, Transportation, Commercial, Residential)
- Statistical Snap of Global Virtual Pipeline Systems Market
- Expansion Analysis of Global Virtual Pipeline Systems Market
- Problems and Obstacles in Global Virtual Pipeline Systems Market
- Competitive Landscape in the Global Virtual Pipeline Systems Market
- Effects of COVID-19 and demonetization on Global Virtual Pipeline Systems Market
- Details on Current Investment in Global Virtual Pipeline Systems Market
- Competitive Landscape of Global Virtual Pipeline Systems Market
- Prominent Players in the Global Virtual Pipeline Systems Market
- SWOT Analysis of Global Virtual Pipeline Systems Market
- Global Virtual Pipeline Systems Market Future Outlook and Projections (FY’2023-FY’2033)
- Recommendations from Analyst
1.1. Scope of the report1.2. Market segment analysis
2.1. Research data source2.1.1. Secondary Data2.1.2. Primary Data2.1.3. SPER’s internal database2.1.4. Premium insight from KOL’s2.2. Market size estimation2.2.1. Top-down and Bottom-up approach2.3. Data triangulation
4.1. Driver, Restraint, Opportunity and Challenges analysis4.1.1. Drivers4.1.2. Restraints4.1.3. Opportunities4.1.4. Challenges4.2. COVID-19 Impacts of the Global Virtual Pipeline Systems Market
5.1. SWOT Analysis5.1.1. Strengths5.1.2. Weaknesses5.1.3. Opportunities5.1.4. Threats5.2. PESTEL Analysis5.2.1. Political Landscape5.2.2. Economic Landscape5.2.3. Social Landscape5.2.4. Technological Landscape5.2.5. Environmental Landscape5.2.6. Legal Landscape5.3. PORTER’s Five Forces5.3.1. Bargaining power of suppliers5.3.2. Bargaining power of buyers5.3.3. Threat of Substitute5.3.4. Threat of new entrant5.3.5. Competitive rivalry5.4. Heat Map Analysis
6.1. Global Virtual Pipeline Systems Market Manufacturing Base Distribution, Sales Area, Product Type6.2. Mergers & Acquisitions, Partnerships, Product Launch, and Collaboration in Global Virtual Pipeline Systems Market
7.1. Global Virtual Pipeline Systems Market Value Share and Forecast, By Type, 2023-20337.2. Standard7.3. Towable
8.1. Global Virtual Pipeline Systems Market Value Share and Forecast, By Gas, 2023-20338.2. CNG8.3. Hydrogen8.4. Others
9.1. Global Virtual Pipeline Systems Market Value Share and Forecast, By Pressure, 2023-20339.2. Less than 3000 Psi9.3. 3001 to 5000 Psi9.4. More than 5000 Psi
10.1. Global Virtual Pipeline Systems Market Value Share and Forecast, By Application, 2023-203310.2. Commercial10.3. Industrial10.4. Residential10.5. Transportation
11.1. Global Virtual Pipeline Systems Market Size and Market Share
12.1. Global Virtual Pipeline Systems Market Size and Market Share By Type (2019-2026)12.2. Global Virtual Pipeline Systems Market Size and Market Share By Type (2027-2033)
13.1. Global Virtual Pipeline Systems Market Size and Market Share By Gas (2019-2026)13.2. Global Virtual Pipeline Systems Market Size and Market Share By Gas (2027-2033)
14.1. Global Virtual Pipeline Systems Market Size and Market Share By Pressure (2019-2026)14.2. Global Virtual Pipeline Systems Market Size and Market Share By Pressure (2027-2033)
15.1. Global Virtual Pipeline Systems Market Size and Market Share By Application (2019-2026)15.2. Global Virtual Pipeline Systems Market Size and Market Share By Application (2027-2033)
16.1. Global Virtual Pipeline Systems Market Size and Market Share By Region (2019-2026)16.2. Global Virtual Pipeline Systems Market Size and Market Share By Region (2027-2033)16.3. Asia-Pacific16.3.1. Australia16.3.2. China16.3.3. India16.3.4. Japan16.3.5. South Korea16.3.6. Rest of Asia-Pacific16.4. Europe16.4.1. France16.4.2. Germany16.4.3. Italy16.4.4. Spain16.4.5. United Kingdom16.4.6. Rest of Europe16.5. Middle East and Africa16.5.1. Kingdom of Saudi Arabia16.5.2. United Arab Emirates16.5.3. Rest of Middle East & Africa16.6. North America16.6.1. Canada16.6.2. Mexico16.6.3. United States16.7. Latin America16.7.1. Argentina16.7.2. Brazil16.7.3. Rest of Latin America
17.1. Composite Advanced Technologies, LLC17.1.1. Company details17.1.2. Financial outlook17.1.3. Product summary17.1.4. Recent developments17.2. Chart Industries Inc.17.2.1. Company details17.2.2. Financial outlook17.2.3. Product summary17.2.4. Recent developments17.3. CNG Services Ltd17.3.1. Company details17.3.2. Financial outlook17.3.3. Product summary17.3.4. Recent developments17.4. Fiba Technologies Inc.17.4.1. Company details17.4.2. Financial outlook17.4.3. Product summary17.4.4. Recent developments17.5. Galileo Technologies S.A17.5.1. Company details17.5.2. Financial outlook17.5.3. Product summary17.5.4. Recent developments17.6. Hexagon Agility17.6.1. Company details17.6.2. Financial outlook17.6.3. Product summary17.6.4. Recent developments17.7. SHIJIAZHUANG ENRIC GAS Equipment Co.17.7.1. Company details17.7.2. Financial outlook17.7.3. Product summary17.7.4. Recent developments17.8. Quantum Fuel Systems LLC17.8.1. Company details17.8.2. Financial outlook17.8.3. Product summary17.8.4. Recent developments17.9. RAG Austria AG17.9.1. Company details17.9.2. Financial outlook17.9.3. Product summary17.9.4. Recent developments17.10. Others
SPER Market Research’s methodology uses great emphasis on primary research to ensure that the market intelligence insights are up to date, reliable and accurate. Primary interviews are done with players involved in each phase of a supply chain to analyze the market forecasting. The secondary research method is used to help you fully understand how the future markets and the spending patterns look likes.
The report is based on in-depth qualitative and quantitative analysis of the Product Market. The quantitative analysis involves the application of various projection and sampling techniques. The qualitative analysis involves primary interviews, surveys, and vendor briefings. The data gathered as a result of these processes are validated through experts opinion. Our research methodology entails an ideal mixture of primary and secondary initiatives.


Frequently Asked Questions About This Report
PLACE AN ORDER
Year End Discount
Sample Report
Pre-Purchase Inquiry
NEED CUSTOMIZATION?
Request CustomizationCALL OR EMAIL US
100% Secure Payment