
Voice of Customer Research Analytical & Scientific Instruments
Overview
The scientific instrument market for analytical scientific instruments supports critical applications across pharmaceuticals, biotechnology, chemicals, food testing, environmental monitoring, and academic research. A Voice of Customer Research (VoC) study based on 100 surveyed users and decision-makers highlights evolving expectations shaped by regulatory pressure, the need for accuracy, and the growing adoption of automation digital technologies across laboratories.
Study Snapshot
- Sample size: 100 respondents
- Key industries: Pharma (28%), Chemical (18%), Academic/Research (15%), plus biotech, food & beverage, environmental testing, CROs
- Roles: End users (30%), Lab managers (25%), Decision-makers (20%)
- Experience: ~60% with more than 5 years of instrument experience
- Data source: Primary survey
Instrument Usage Landscape
- Most used instruments: HPLC, UV-Vis, GC, followed by FTIR and LC-MS/MS
- Focus on routine QC and research applications
- ~60% of installed instruments are older than 3 years, indicating strong replacement and upgrade potential in the scientific instrument market
Key Purchase Decision Drivers
Top decision factors:
- Accuracy & precision
- Reliability
- After-sales service
- Brand reputation
- Regulatory compliance
- Price is important but secondary to performance and dependability
- Purchasing decisions are multi-stakeholder driven (technical + commercial)
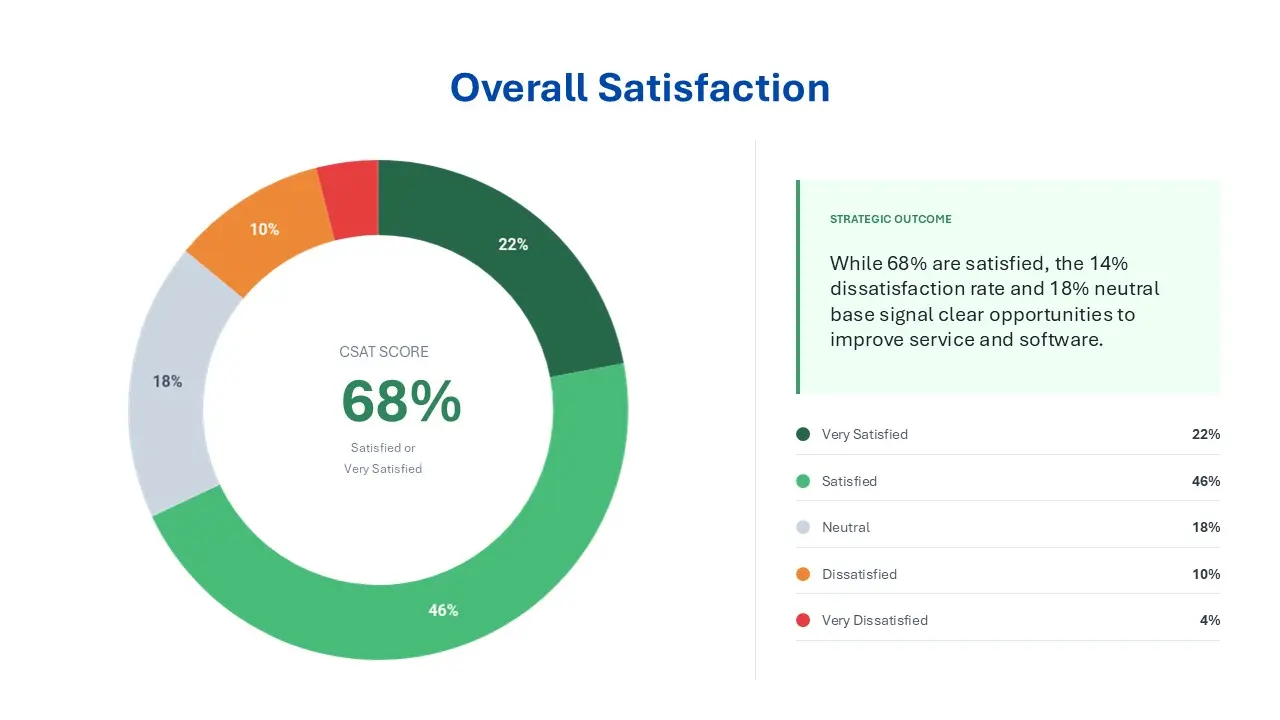
Customer Satisfaction Snapshot
- 68% satisfied or very satisfied overall
- Strong performance ratings for:
- Accuracy & repeatability
- Overall instrument performance
- Installation support & technical competence
- Key weakness areas:
- Service response time
- Spare parts availability
- Training quality
- Software usability
- ~25% experience frequent downtime, directly impacting productivity
Major Customer Pain Points
- High maintenance and AMC costs
- Slow service response
- Delayed spare parts availability
- Complex or unintuitive software
- Occasional breakdowns
- Inadequate user training
Service-related issues outweigh product performance concerns and dominate dissatisfaction drivers.
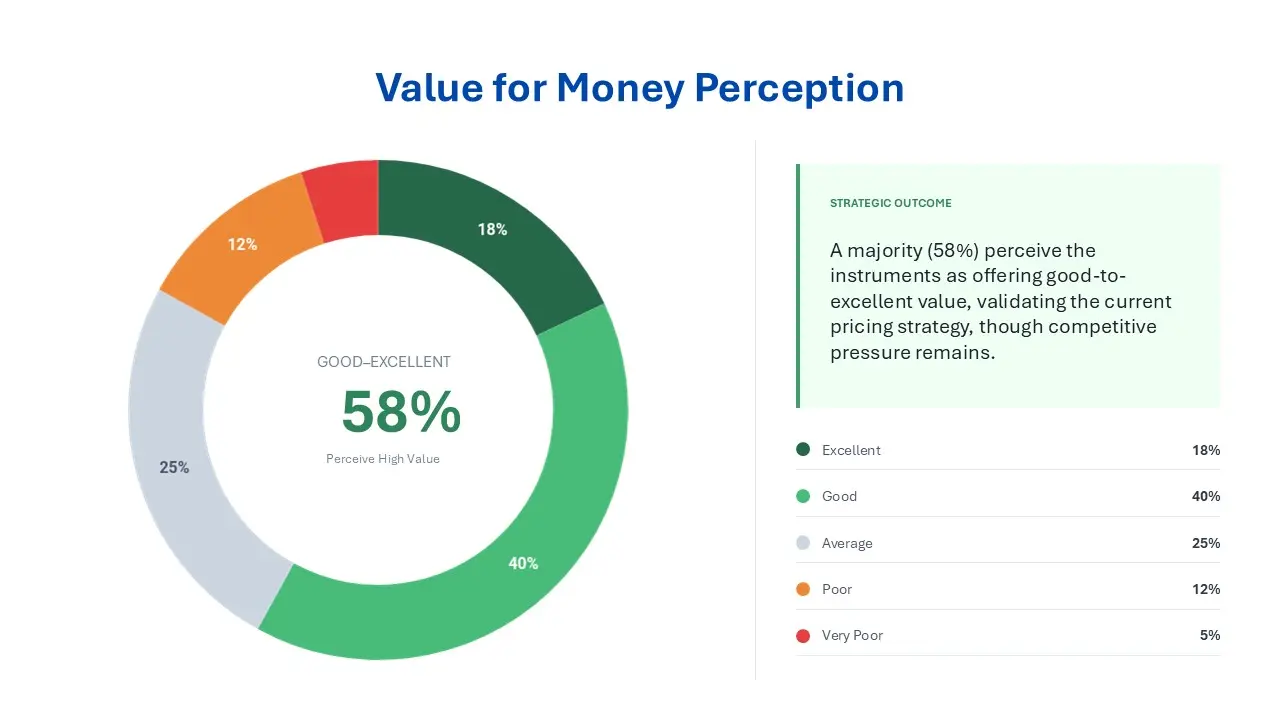
Pricing & Value Perception
- Majority perceive good-to-excellent value for money
- ~1/3 rate value as average or below due to high ownership costs
Preferred pricing models:
- One-time purchase (most preferred)
- AMC-bundled offerings
- Growing interest in:
- Leasing
- Subscription models
- Pay-per-use pricing
Brand Loyalty & Switching Behavior
- ~60% likely to repurchase the same brand
- Net Promoter Score (NPS): +2 (neutral)
Top switching drivers:
- Better after-sales service
- Improved performance
- Competitive pricing
- Access to newer technologies
- Poor past service experience
Service quality is the single strongest driver of both loyalty and churn.
Future Expectations & Innovation Priorities
- Higher automation levels
- Predictive maintenance
- Remote monitoring & diagnostics
- User-friendly software interfaces
- Regulatory-ready reporting
- AI-assisted troubleshooting
Top demand signals include automation digital technologies and predictive maintenance to reduce downtime and improve efficiency, reflecting broader laboratory equipment trends.
Conclusion
The Voice of Customer Research analysis reveals a mature yet opportunity-rich scientific instrument market. While customers value the accuracy and reliability of analytical scientific instruments, dissatisfaction with service responsiveness, maintenance costs, and software usability limits stronger loyalty. To strengthen competitive advantage, manufacturers must move from a product-centric to a customer-experience–driven approach by investing in faster service, proactive maintenance, digital integration, and flexible commercial models aligned with emerging laboratory equipment trends. Doing so can significantly enhance customer satisfaction, retention, and long-term growth.


