Global Pure Waterjet Cutting Market Insights, Size & Growth Forecast To 2027
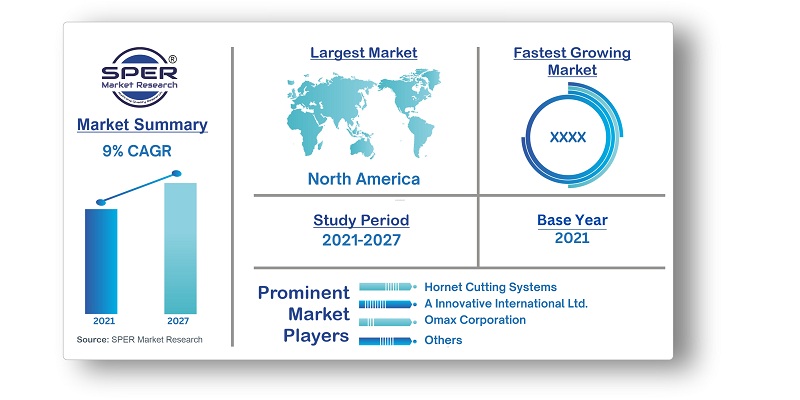
Global Pure Waterjet Cutting Market- By Product (One dimensional cutting, Two-dimensional cutting, Three- dimensional cutting), By Pressure Range (Up to 4,200 Bar, More than 4,200 Bar), By Horse Power (0 to 50 HP, 51 to 100 HP, More than 100 HP), By Application (Paper, Fiber Glass Cutting, Gasket Cutting, Foam Product Cutting, Plastic Cutting, Others), By End-User (Automotive, FMCG, Textile, Electronic, Others), and By Region (North America, Europe, Asia Pacific, South America, and Middle East, & Africa)- Global forecast from 2020-2027.
| Published: Feb-2021 | Report ID: FOOD2107 | Pages: 1 - 250 | Formats*: |
| Category : Food & Beverages | |||
1.1. Market Modelling1.2. Product Analysis1.3. Market Trend and Economic Factors Analysis1.4. Market Segmental Analysis1.5. Geographical Mapping1.6. Country Wise Segregation
2.1. Identification of Target Market2.2. Data Acquisition2.3. Refining of Data/ Data Transformations2.4. Data Validation through Primary Techniques2.5. Exploratory Data Analysis2.6. Graphical Techniques/Analysis2.7. Quantitative Techniques/Analysis2.8. Visual Result/Presentation
4.1. Economic Factor Analysis4.1.1. Drivers4.1.2. Trends4.1.3. Opportunities4.1.4. Challenges4.2. Competitors & Product Analysis4.3. Regulatory Framework4.4. Company market share analysis, 20194.5. Porter’s Five forces analysis4.6. New Investment Analysis4.7. PESTEL Analysis
5.1. Market Size & Forecast, 2016-20275.1.1. Demand5.1.1.1. By Value (USD Million)5.2. Market Share & Forecast, 2016-20275.2.1. By Product5.2.1.1. One dimensional cutting5.2.1.2. Two-dimensional cutting5.2.1.3. Three- dimensional cutting5.2.2. By Pressure Range5.2.2.1. Up to 4,200 Bar5.2.2.2. More than 4,200 Bar5.2.3. By Horse Power5.2.3.1. 0 to 50 HP5.2.3.2. 51 to 100 HP5.2.3.3. More than 100 HP5.2.4. By Application5.2.4.1. Paper5.2.4.2. Fiber Glass Cutting5.2.4.3. Gasket Cutting5.2.4.4. Foam Product Cutting5.2.4.5. Plastic Cutting5.2.4.6. Others5.2.5. By End-User5.2.5.1. Automotive5.2.5.2. FMCG5.2.5.3. Textile5.2.5.4. Electronic5.2.5.5. Others5.2.6. By Region5.2.6.1. Europe5.2.6.2. North America5.2.6.3. Asia Pacific5.2.6.4. South America5.2.6.5. Middle East & Africa
6.1. Europe Pure Waterjet Cutting Size & Forecast, 2016-20276.1.1. Demand6.1.1.1. By Value (USD Million)6.2. Europe Pure Waterjet Cutting Market Share & Forecast, 2016-20276.2.1. By Product6.2.1.1. One dimensional cutting6.2.1.2. Two-dimensional cutting6.2.1.3. Three- dimensional cutting6.2.2. By Pressure Range6.2.2.1. Up to 4,200 Bar6.2.2.2. More than 4,200 Bar6.2.3. By Horse Power6.2.3.1. 0 to 50 HP6.2.3.2. 51 to 100 HP6.2.3.3. More than 100 HP6.2.4. By Application6.2.4.1. Paper6.2.4.2. Fiber Glass Cutting6.2.4.3. Gasket Cutting6.2.4.4. Foam Product Cutting6.2.4.5. Plastic Cutting6.2.4.6. Others6.2.5. By End-User6.2.5.1. Automotive6.2.5.2. FMCG6.2.5.3. Textile6.2.5.4. Electronic6.2.5.5. Others6.2.6. By Country6.2.6.1. Germany6.2.6.2. UK6.2.6.3. France6.2.6.4. Italy6.2.6.5. Rest of Europe6.2.7. Company Market Share (Top 3-5)6.2.8. Economic Impact Study on Europe Pure Waterjet Cutting Market
7.1. North America Pure Waterjet Cutting Market Size & Forecast, 2016-20277.1.1. Demand7.1.1.1. By Value (USD Million)7.2. North America Pure Waterjet Cutting Market Share & Forecast, 2016-20277.2.1. By Product7.2.1.1. One dimensional cutting7.2.1.2. Two-dimensional cutting7.2.1.3. Three- dimensional cutting7.2.2. By Pressure Range7.2.2.1. Up to 4,200 Bar7.2.2.2. More than 4,200 Bar7.2.3. By Horse Power7.2.3.1. 0 to 50 HP7.2.3.2. 51 to 100 HP7.2.3.3. More than 100 HP7.2.4. By Application7.2.4.1. Paper7.2.4.2. Fiber Glass Cutting7.2.4.3. Gasket Cutting7.2.4.4. Foam Product Cutting7.2.4.5. Plastic Cutting7.2.4.6. Others7.2.5. By End-User7.2.5.1. Automotive7.2.5.2. FMCG7.2.5.3. Textile7.2.5.4. Electronic7.2.5.5. Others7.2.6. By Country7.2.6.1. US7.2.6.2. Canada7.2.6.3. Mexico7.2.7. Company Market Share (Top 3-5)7.2.8. Economic Impact Study on North America Pure Waterjet Cutting Market
8.1. Asia Pacific Pure Waterjet Cutting Market Size & Forecast, 2016-20278.1.1. Demand8.1.1.1. By Value (USD Million)8.2. Asia Pacific Pure Waterjet Cutting Market Share & Forecast, 2016-20278.2.1. By Product8.2.1.1. One dimensional cutting8.2.1.2. Two-dimensional cutting8.2.1.3. Three- dimensional cutting8.2.2. By Pressure Range8.2.2.1. Up to 4,200 Bar8.2.2.2. More than 4,200 Bar8.2.3. By Horse Power8.2.3.1. 0 to 50 HP8.2.3.2. 51 to 100 HP8.2.3.3. More than 100 HP8.2.4. By Application8.2.4.1. Paper8.2.4.2. Fiber Glass Cutting8.2.4.3. Gasket Cutting8.2.4.4. Foam Product Cutting8.2.4.5. Plastic Cutting8.2.4.6. Others8.2.5. By End-User8.2.5.1. Automotive8.2.5.2. FMCG8.2.5.3. Textile8.2.5.4. Electronic8.2.5.5. Others8.2.6. By Country8.2.6.1. China8.2.6.2. India8.2.6.3. Japan8.2.6.4. Australia8.2.6.5. Rest of Asia Pacific8.2.7. Company Market Share (Top 3-5)8.2.8. Economic Impact Study on Asia Pacific Pure Waterjet Cutting Market
9.1. South America Pure Waterjet Cutting Market Size & Forecast, 2016-20279.1.1. Demand9.1.1.1. By Value (USD Million)9.2. South America Pure Waterjet Cutting Market Share & Forecast, 2016-20279.2.1. By Product9.2.1.1. One dimensional cutting9.2.1.2. Two-dimensional cutting9.2.1.3. Three- dimensional cutting9.2.2. By Pressure Range9.2.2.1. Up to 4,200 Bar9.2.2.2. More than 4,200 Bar9.2.3. By Horse Power9.2.3.1. 0 to 50 HP9.2.3.2. 51 to 100 HP9.2.3.3. More than 100 HP9.2.4. By Application9.2.4.1. Paper9.2.4.2. Fiber Glass Cutting9.2.4.3. Gasket Cutting9.2.4.4. Foam Product Cutting9.2.4.5. Plastic Cutting9.2.4.6. Others9.2.5. By End-User9.2.5.1. Automotive9.2.5.2. FMCG9.2.5.3. Textile9.2.5.4. Electronic9.2.5.5. Others9.2.6. By Country9.2.6.1. Brazil9.2.6.2. Argentina9.2.6.3. Rest of South America9.2.7. Company Market Share (Top 3-5)9.2.8. Economic Impact Study on South America Pure Waterjet Cutting Market
10.1. Middle East & Africa Pure Waterjet Cutting Market Size & Forecast, 2016-202710.1.1. Demand10.1.1.1. By Value (USD Million)10.2. Middle East & Africa Pure Waterjet Cutting Market Share & Forecast, 2016-202710.2.1. By Product10.2.1.1. One dimensional cutting10.2.1.2. Two-dimensional cutting10.2.1.3. Three- dimensional cutting10.2.2. By Pressure Range10.2.2.1. Up to 4,200 Bar10.2.2.2. More than 4,200 Bar10.2.3. By Horse Power10.2.3.1. 0 to 50 HP10.2.3.2. 51 to 100 HP10.2.3.3. More than 100 HP10.2.4. By Application10.2.4.1. Paper10.2.4.2. Fiber Glass Cutting10.2.4.3. Gasket Cutting10.2.4.4. Foam Product Cutting10.2.4.5. Plastic Cutting10.2.4.6. Others10.2.5. By End-User10.2.5.1. Automotive10.2.5.2. FMCG10.2.5.3. Textile10.2.5.4. Electronic10.2.5.5. Others10.2.6. By Country10.2.6.1. Saudi Arabia10.2.6.2. UAE10.2.6.3. South Africa10.2.6.4. Rest of Middle East & Africa10.2.7. Company Market Share (Top 3-5)10.2.8. Economic Impact Study on Middle East & Africa Pure Waterjet Cutting Market
11.1. Company Description11.2. Financial Analysis11.3. Key Products11.4. Key Management Personnel11.5. Contact Address11.6. SWOT Analysis11.7. Company Profile11.7.1.1. Colfax Corporation11.7.1.2. Dardi International Corporation11.7.1.3. Omax Corporation11.7.1.4. Flow International Corporation11.7.1.5. Koike Aronson, Inc.11.7.1.6. Hornet Cutting Systems11.7.1.7. A Innovative International Ltd.11.7.1.8. WARDJet, Inc. (AXYZ Automation Group)11.7.1.9. Other players
SPER Market Research’s methodology uses great emphasis on primary research to ensure that the market intelligence insights are up to date, reliable and accurate. Primary interviews are done with players involved in each phase of a supply chain to analyze the market forecasting. The secondary research method is used to help you fully understand how the future markets and the spending patterns look likes.
The report is based on in-depth qualitative and quantitative analysis of the Product Market. The quantitative analysis involves the application of various projection and sampling techniques. The qualitative analysis involves primary interviews, surveys, and vendor briefings. The data gathered as a result of these processes are validated through experts opinion. Our research methodology entails an ideal mixture of primary and secondary initiatives.


Frequently Asked Questions About This Report
PLACE AN ORDER
Year End Discount
Sample Report
Pre-Purchase Inquiry
NEED CUSTOMIZATION?
Request CustomizationCALL OR EMAIL US
100% Secure Payment