E-fuel Market Growth, Size, Trends, Analysis and Future Outlook

E-fuel Market Growth, Size, Trends Analysis - By Product, By State, By Production Method, By Technology, By End-User - Regional Outlook, Competitive Strategies and Segment Forecast to 2034

Published: May-2025 Report ID: POAE2529 Pages: 1 - 250 Formats*:     
Category : Power & Energy
E-fuel Market Introduction and Overview 

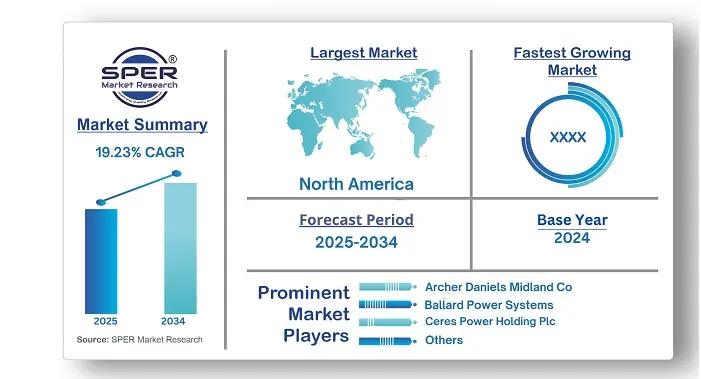
According to SPER Market Research, the Global E-fuel Market is estimated to reach USD 940.35 billion by 2034 with a CAGR of 19.23%.

The report includes an in-depth analysis of the Global E-fuel Market, including market size and trends, product mix, Applications, and supplier analysis. The global e-fuel market is predicted to be worth USD 161.97 billion in 2024 and develop at a compound annual growth rate (CAGR) of 19.23% between 2025 and 2034. This increase is linked to a growing need for clean and sustainable e-fuels to reduce countries' reliance on fossil fuels, which are major contributors to climate change and air pollution.

By Product Insights:
The market has been divided into various product categories, including ethanol, hydrogen (green hydrogen), e-diesel, e-gasoline, e-kerosene, e-methane, e-methanol, and others. In 2024, the ethanol segment accounted for the largest portion of the total revenue. This is explained by a number of global government initiatives and investments aimed at increasing production.

By State Insights:
The e-fuel market is divided into liquid and gas categories according to state. The liquid state segment had the largest market share in 2024, in terms of revenue, and is expected to maintain this position. This growth is due to its use in powering vehicles, generators, and industrial operations without major setup changes. The gas state segment is anticipated to grow the fastest from 2025 to 2034, mainly due to its use in power generation and heating, fitting well within existing gas infrastructure.

By Production Method Insights:
Based on production method, the e-fuel market is divided into power-to-liquid, power-to-gas, gas-to-liquid, and biologically derived fuels. The power-to-liquid segment had the largest share in 2024 due to its sustainable way of creating liquid e-fuels, using renewable energy to address environmental issues with traditional fuels.
The gas-to-liquid segment is projected to grow the fastest from 2025 to 2034. Gas-to-Liquid (GTL) technology transforms gases like natural gas into liquid hydrocarbons through Fischer-Tropsch synthesis, using gas feedstock from processes like gasification, which fuels this segment's growth.

By Technology Insights:
The market for e-fuel is divided into technological segments, such as reverse-water-gas-shift, fischer-tropsch, and hydrogen technology (electrolysis). In 2024, the hydrogen technology segment had the largest revenue share. It is growing fast as a clean way to produce hydrogen using renewable and nuclear sources. Types of hydrogen technology include polymer electrolyte membranes (PEM) and alkaline electrolyzers.

By End-User Insights:
The market for e-fuel is segmented by end-user, including automotive, marine, industrial, railway, aviation, and others. The automotive segment had the largest revenue share in 2024 because e-fuels, like e-diesel and e-gasoline, can easily replace traditional petroleum fuels in regular engines without major changes for automakers.
The others segment, which includes the agriculture industry, is expected to grow the fastest from 2025 to 2034. This growth is due to e-fuels from renewable sources being viable alternatives to traditional fossil fuels in agricultural machinery such as tractors and harvesters.

Regional Insights:
Europe had the largest market share in 2024 in terms of revenue and is predicted to grow significantly from 2025 to 2034. This growth is due to supportive government policies in the region, like the Renewable Energy Directive (RED II), which requires the use of e-fuels, such as e-diesel and e-kerosene, in transportation.
North America is expected to grow at the fastest rate during the forecast period because of strong federal government support in countries like the U. S. and Canada. These countries provide significant funding for pilot projects to improve renewable fuel technologies and are implementing strict rules to reduce greenhouse gas emissions and promote clean energy.


Market Competitive Landscape:
The market is competitive since it has a wide range of regional and international participants. To survive the fierce competition and grow their market share, the top businesses in the globe are employing agreements, partnerships, mergers, acquisitions, and collaborations. In order to create cutting-edge goods and incorporate new features and technologies to save energy and boost efficiency, e-fuel manufacturers are investing heavily in research and development.

Recent Developments:
In March 2024, Infinium opened a commercial-scale green hydrogen e-fuel production facility in Corpus Christi, Texas. The installation, known as Project Pathfinder, generates electronic fuels from captured carbon dioxide (CO2) and green hydrogen using a patented process that includes catalysts and on-site electrolysers.
Siemens Energy, a worldwide energy technology leader, collaborated with Liquid Wind in May 2023 to manufacture eFuel, which would reduce shipping emissions. Siemens Energy provides equity investment, technology, and expertise in the development of eMethanol facilities.

Scope of the report:
 Report Metric Details
Market size available for years 2021-2034
Base year considered 2024
 Forecast period 2025-2034
Segments coveredBy Product, By State, By Production Method, By Technology, By End-User
Regions coveredNorth America, Latin America, Asia-Pacific, Europe, and Middle East & Africa
Companies CoveredArcher Daniels Midland Co, Ballard Power Systems, Inc, Ceres Power Holding Plc, Clean Fuels Alliance America, Climeworks AG, E-Fuel Corporation, eFuel Pacific Limited, Hexagon Agility, Neste, Norsk e-Fuel AS.
Key Topics Covered in the Report:
  • Global E-fuel Market Size (FY’2021-FY’2034)
  • Overview of Global E-fuel Market
  • Segmentation of Global E-fuel Market By Product (E-Diesel, E-Gasoline, Ethanol, Hydrogen, E-Kerosene, E-Methane, E-Methanol, Others)
  • Segmentation of Global E-fuel Market By State (Liquid, Gas)
  • Segmentation of Global E-fuel Market By Production Method (Power-to-Liquid, Power-to-Gas, Gas-to-Liquid, Biologically derived fuels)
  • Segmentation of Global E-fuel Market By Technology (Hydrogen technology, Fischer-Tropsch, Reverse-Water-Gas-Shift)
  • Segmentation of Global E-fuel Market By End-User (Automotive, Marine, Industrial, Railway, Aviation, Others)
  • Statistical Snap of Global E-fuel Market
  • Expansion Analysis of Global E-fuel Market
  • Problems and Obstacles in Global E-fuel Market
  • Competitive Landscape in the Global E-fuel Market
  • Details on Current Investment in Global E-fuel Market
  • Competitive Analysis of Global E-fuel Market
  • Prominent Players in the Global E-fuel Market
  • SWOT Analysis of Global E-fuel Market
  • Global E-fuel Market Future Outlook and Projections (FY’2025-FY’2034)
  • Recommendations from Analyst


1. Introduction
  • 1.1. Scope of the report
  • 1.2. Market segment analysis
2. Research Methodology
  • 2.1. Research data source
    • 2.1.1. Secondary Data
    • 2.1.2. Primary Data
    • 2.1.3. SPER’s internal database
    • 2.1.4. Premium insight from KOL’s
  • 2.2. Market size estimation
    • 2.2.1. Top-down and Bottom-up approach
    • 2.3. Data triangulation
3. Executive Summary

4. Market Dynamics
  • 4.1. Driver, Restraint, Opportunity and Challenges analysis
    • 4.1.1. Drivers
    • 4.1.2. Restraints
    • 4.1.3. Opportunities
    • 4.1.4. Challenges
5. Market variable and outlook
  • 5.1. SWOT Analysis
    • 5.1.1. Strengths
    • 5.1.2. Weaknesses
    • 5.1.3. Opportunities
    • 5.1.4. Threats
  • 5.2. PESTEL Analysis
    • 5.2.1. Political Landscape
    • 5.2.2. Economic Landscape
    • 5.2.3. Social Landscape
    • 5.2.4. Technological Landscape
    • 5.2.5. Environmental Landscape
    • 5.2.6. Legal Landscape
  • 5.3. PORTER’s Five Forces 
    • 5.3.1. Bargaining power of suppliers
    • 5.3.2. Bargaining power of buyers
    • 5.3.3. Threat of Substitute
    • 5.3.4. Threat of new entrant
    • 5.3.5. Competitive rivalry
  • 5.4. Heat Map Analysis
6. Competitive Landscape
  • 6.1. Global E-fuel Market Manufacturing Base Distribution, Sales Area, Product Type 
  • 6.2. Mergers & Acquisitions, Partnerships, Product Launch, and Collaboration in Global E-fuel Market
7. Global E-fuel Market, By Product (USD Million) 2021-2034
  • 7.1. E-Diesel
  • 7.2. E-Gasoline
  • 7.3. Ethanol
  • 7.4. Hydrogen
  • 7.5. E-Kerosene
  • 7.6. E-Methane
  • 7.7. E-Methanol
  • 7.8. Others
8. Global E-fuel Market, By State (USD Million) 2021-2034
  • 8.1. Liquid
  • 8.2. Gas
9. Global E-fuel Market, By Production Method (USD Million) 2021-2034
  • 9.1. Power-to-Liquid
  • 9.2. Power-to-Gas
  • 9.3. Gas-to-Liquid
  • 9.4. Biologically derived fuels
10. Global E-fuel Market, By Technology (USD Million) 2021-2034
  • 10.1. Hydrogen technology (Electrolysis)
  • 10.2. Fischer-Tropsch
  • 10.3. Reverse-Water-Gas-Shift (RWGS)
11. Global E-fuel Market, By End-User (USD Million) 2021-2034
  • 11.1. Automotive
  • 11.2. Marine
  • 11.3. Industrial
  • 11.4. Railway
  • 11.5. Aviation
  • 11.6. Others
12. Global E-fuel Market, (USD Million) 2021-2034
  • 12.1. Global E-fuel Market Size and Market Share
13. Global E-fuel Market, By Region, (USD Million) 2021-2034
  • 13.1. Asia-Pacific
    • 13.1.1. Australia
    • 13.1.2. China
    • 13.1.3. India
    • 13.1.4. Japan
    • 13.1.5. South Korea
    • 13.1.6. Rest of Asia-Pacific
  • 13.2. Europe
    • 13.2.1. France
    • 13.2.2. Germany
    • 13.2.3. Italy
    • 13.2.4. Spain
    • 13.2.5. United Kingdom
    • 13.2.6. Rest of Europe
  • 13.3. Middle East and Africa
    • 13.3.1. Kingdom of Saudi Arabia 
    • 13.3.2. United Arab Emirates
    • 13.3.3. Qatar
    • 13.3.4. South Africa
    • 13.3.5. Egypt
    • 13.3.6. Morocco
    • 13.3.7. Nigeria
    • 13.3.8. Rest of Middle-East and Africa
  • 13.4. North America
    • 13.4.1. Canada
    • 13.4.2. Mexico
    • 13.4.3. United States
  • 13.5. Latin America
    • 13.5.1. Argentina
    • 13.5.2. Brazil
    • 13.5.3. Rest of Latin America 
14. Company Profile
  • 14.1. Archer Daniels Midland Co
    • 14.1.1. Company details
    • 14.1.2. Financial outlook
    • 14.1.3. Product summary 
    • 14.1.4. Recent developments
  • 14.2. Ballard Power Systems, Inc
    • 14.2.1. Company details
    • 14.2.2. Financial outlook
    • 14.2.3. Product summary 
    • 14.2.4. Recent developments
  • 14.3. Ceres Power Holding Plc
    • 14.3.1. Company details
    • 14.3.2. Financial outlook
    • 14.3.3. Product summary 
    • 14.3.4. Recent developments
  • 14.4. Clean Fuels Alliance America
    • 14.4.1. Company details
    • 14.4.2. Financial outlook
    • 14.4.3. Product summary 
    • 14.4.4. Recent developments
  • 14.5. Climeworks AG
    • 14.5.1. Company details
    • 14.5.2. Financial outlook
    • 14.5.3. Product summary 
    • 14.5.4. Recent developments
  • 14.6. E-Fuel Corporation
    • 14.6.1. Company details
    • 14.6.2. Financial outlook
    • 14.6.3. Product summary 
    • 14.6.4. Recent developments
  • 14.7. eFuel Pacific Limited
    • 14.7.1. Company details
    • 14.7.2. Financial outlook
    • 14.7.3. Product summary 
    • 14.7.4. Recent developments
  • 14.8. Hexagon Agility
    • 14.8.1. Company details
    • 14.8.2. Financial outlook
    • 14.8.3. Product summary 
    • 14.8.4. Recent developments
  • 14.9. Neste
    • 14.9.1. Company details
    • 14.9.2. Financial outlook
    • 14.9.3. Product summary 
    • 14.9.4. Recent developments
  • 14.10. Norsk e-Fuel AS
    • 14.10.1. Company details
    • 14.10.2. Financial outlook
    • 14.10.3. Product summary 
    • 14.10.4. Recent developments
  • 14.11. Others
15. Conclusion

16. List of Abbreviations

17. Reference Links

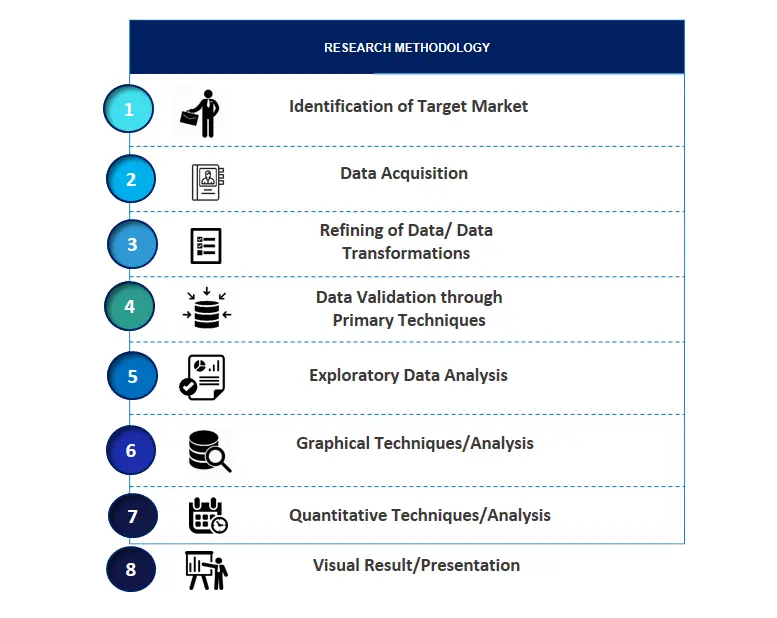
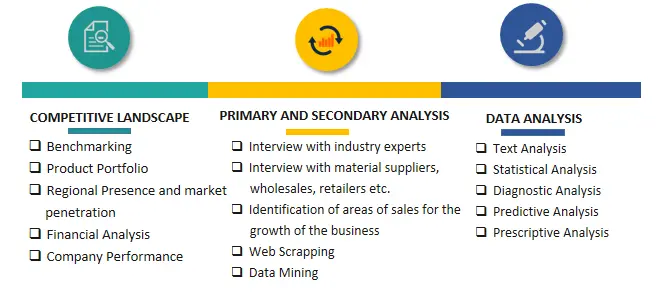
SPER Market Research’s methodology uses great emphasis on primary research to ensure that the market intelligence insights are up to date, reliable and accurate. Primary interviews are done with players involved in each phase of a supply chain to analyze the market forecasting. The secondary research method is used to help you fully understand how the future markets and the spending patterns look likes.

The report is based on in-depth qualitative and quantitative analysis of the Product Market. The quantitative analysis involves the application of various projection and sampling techniques. The qualitative analysis involves primary interviews, surveys, and vendor briefings.  The data gathered as a result of these processes are validated through experts opinion. Our research methodology entails an ideal mixture of primary and secondary initiatives.
SPER-Methodology-1

SPER-Methodology-2

SPER-Methodology-3


Frequently Asked Questions About This Report
E-fuel Market CAGR of 19.23% during the forecast period.
E-fuel Market size is USD 940.35 billion from 2025 to 2034.
E-fuel Market is projected to reach USD 940.35 billion by 2034, growing at a CAGR of of 19.23% during the forecast period.
E-fuel Market grew in Market size from 2025. The Market is expected to reach USD 940.35 billion by 2034, at a CAGR of 19.23% during the forecast period.
You can get the sample pages by clicking the link - Click Here
E-fuel Market is covered By Product, By State, By Production Method, By Technology, By End-User
The North America, Latin America, Asia-Pacific, Europe, and Middle East & Africa is the highest Market share in the E-fuel Market.
AArcher Daniels Midland Co, Ballard Power Systems, Inc, Ceres Power Holding Plc, Clean Fuels Alliance America, Climeworks AG, E-Fuel Corporation, eFuel Pacific Limited, Hexagon Agility, Neste, Norsk e-Fuel AS.
The report includes an in-depth analysis of the Global E-fuel Market, including market size and trends, product mix, Applications, and supplier analysis.
PLACE AN ORDER
  • 15 % off
     
    $ 4250
  • 20 % off
             
    $ 5650
  • 25 % off
         
    $ 7450
Pre-Purchase Inquiry
SEND AN INQUIRY
NEED CUSTOMIZATION?
Request Customization
CALL OR EMAIL US
US:
India:
Email:
100% Secure Payment

SPER American Express
SPER VISA
SPER Master Card
SPER Mestro
SPER Paypal
SPER CCAvenues

Have a glance of the Report

  Download Free Sample

Looking for Customization?

 Customization Request

Have a Question?

 Reach Our Analysis Team

COVID-19 impact analysis?

 Request Analysis

Our Global Clients

Our data-driven insights have influenced the strategy of 200+ reputed companies across the globe.

SPER-Astellas Pharma
SPER-Microsoft
SPER-EY
SPER-McKinsey
SPER-Bain
SPER-Max-Healthcare
SPER-DHL
SPER-IQVIA
SPER-Mitsubishi Logistics
SPER-PACCOR
SPER-Macmillan Education
SPER-Kankar IMRB
SPER-ITA
SPER-PWC
SPER-SAPTCA
SPER-Straumann
SPER-MENARINI Silicon Biosystems
SPER-IPSOS
SPER-Heineken