Reactive Diluents Market Introduction and Overview
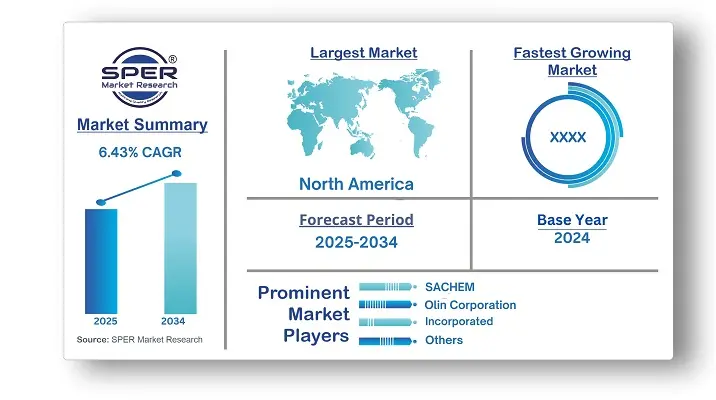
According to SPER Market Research, the Global Reactive Diluents Market is estimated to reach USD 2.09 billion by 2034 with a CAGR of 6.43%.
The report includes an in-depth analysis of the Global Reactive Diluents Market, including market size and trends, product mix, Applications, and supplier analysis. The global reactive diluents market was valued at USD 1.12 billion in 2024 and is expected to increase at a CAGR of 6.43% between 2025 and 2034. The product's broad applications as thinners, viscosity modifiers, and rheology modifiers are driving up market demand. They are integrated into adhesives, sealants, paints, and varnishes at the proper concentration for their intended use.
By Product Insights
The aliphatic segment led the market in 2024, gaining the largest revenue share. This increase is due to aliphatic compounds having excellent performance traits such as UV resistance, high chemical resistance, weather ability, and durability, making them suitable for uses like composites, adhesives, and coatings. The market is also known for its versatility and compatibility with various resins, allowing manufacturers flexibility in product development.
Aromatic segments are a kind of reactive diluent known for their aromatic structure, which enhances composite properties. Their capacity to lower resin viscosity without sacrificing mechanical or thermal integrity is the reason they were selected. Their aromatic nature improves compatibility with certain resin formulations and ensures strong integration into the polymer matrix.
By Application Insights
The paints and coatings segment led the market in 2024, generating the largest revenue share due to their widespread use in various sectors. Reactive diluents are key components in these formulations, helping to adjust viscosity, enable crosslinking, and enhance adhesion and durability. The demand for high-performance coatings with qualities like chemical resistance, scratch resistance, and weatherability has increased the use of reactive diluents.These diluents are vital for improving processing and mechanical properties in composites. They lower the viscosity of resin systems for easier manufacturing and better reinforcement fiber bonding. Unlike traditional solvents, reactive diluents integrate into the polymer matrix without compromising thermal or mechanical properties.
Regional Insights
The reactive diluents market is divided into five regions: Asia-Pacific, Europe, North America, the Middle East and Africa, and South America. APAC is the world's largest and fastest-growing reactive diluents market, driven by increased investment in the construction and industrial sectors, as well as the region's rapidly growing population. Increasing consumer spending power has accelerated the expansion of several sectors in this region. These factors are projected to drive up demand for reactive diluents in the region throughout the forecast period.
Market Competitive Landscape
ADEKA CORPORATION, Aditya Birla Chemicals, Arkema, Atul Ltd, and BASF SE are key leaders in the reactive diluents market, thanks to their extensive experience, innovative products, and global reach. ADEKA Corporation is a top manufacturer and supplier, providing a variety of high-quality products for different industries. They emphasize innovation and sustainability, influencing the global reactive diluents market. Similarly, Aditya Birla Chemicals produces high-quality reactive diluents and focuses on innovation and sustainability to meet the changing needs of customers worldwide.
Recent Developments:
Huntsman Corporation declared in April 2023 that it has obtained REDcert2 accreditation and implemented a mass balancing concept at its production facility in Monthey, Switzerland. The manufacturing of epoxy resin products used in a range of consumer and industrial markets is covered by the certification.
In July 2024, BASF SE, a leading chemical firm, introduced a new eco-friendly reactive diluent for coatings that reduces VOC emissions by 30% and improves industrial sustainability.
Speciality chemicals manufacturer Evonik Industries AG introduced a high-performance reactive diluent for adhesives in May 2024, enhancing the flexibility and durability of the product.
Scope of the report:
| Report Metric | Details |
| Market size available for years | 2021-2034 |
| Base year considered | 2024 |
| Forecast period | 2025-2034 |
| Segments covered | By Product, By Application |
| Regions covered | North America, Latin America, Asia-Pacific, Europe, and Middle East & Africa |
| Companies Covered | Mama Mio U.S. Inc., Clarins Group, Novena Maternity, E.T. Browne Drug Co., Inc., Expanscience Laboratories, Inc., Noodle & Boo, Abbott, The Honest Company, Inc., Lansinoh Laboratories, Mankind Pharma.
|
Key Topics Covered in the Report
- Global Reactive Diluents Market Size (FY’2021-FY’2034)
- Overview of Global Reactive Diluents Market
- Segmentation of Global Reactive Diluents Market By Product (Aliphatic, Aromatic, Cycloaliphatic),
- Segmentation of Global Reactive Diluents Market By Application (Paints & Coatings, Composites, Adhesives & Sealants)
- Statistical Snap of Global Reactive Diluents Market
- Expansion Analysis of Global Reactive Diluents Market
- Problems and Obstacles in Global Reactive Diluents Market
- Competitive Landscape in the Global Reactive Diluents Market
- Details on Current Investment in Global Reactive Diluents Market
- Competitive Analysis of Global Reactive Diluents Market
- Prominent Players in the Global Reactive Diluents Market
- SWOT Analysis of Global Reactive Diluents Market
- Global Reactive Diluents Market Future Outlook and Projections (FY’2025-FY’2034)
- Recommendations from Analyst
1. Introduction
1.1. Scope of the report
1.2. Market segment analysis
2. Research Methodology
2.1. Research data source
2.1.1. Secondary Data
2.1.2. Primary Data
2.1.3. SPER’s internal database
2.1.4. Premium insight from KOL’s
2.2. Market size estimation
2.2.1. Top-down and Bottom-up approach
2.3. Data triangulation
3. Executive Summary
4. Market Dynamics
4.1. Driver, Restraint, Opportunity and Challenges analysis
4.1.1. Drivers
4.1.2. Restraints
4.1.3. Opportunities
4.1.4. Challenges
5. Market variable and outlook
5.1. SWOT Analysis
5.1.1. Strengths
5.1.2. Weaknesses
5.1.3. Opportunities
5.1.4. Threats
5.2. PESTEL Analysis
5.2.1. Political Landscape
5.2.2. Economic Landscape
5.2.3. Social Landscape
5.2.4. Technological Landscape
5.2.5. Environmental Landscape
5.2.6. Legal Landscape
5.3. PORTER’s Five Forces
5.3.1. Bargaining power of suppliers
5.3.2. Bargaining power of buyers
5.3.3. Threat of Substitute
5.3.4. Threat of new entrant
5.3.5. Competitive rivalry
5.4. Heat Map Analysis
6. Competitive Landscape
6.1. Global Reactive Diluents Market Manufacturing Base Distribution, Sales Area, Product Type
6.2. Mergers & Acquisitions, Partnerships, Product Launch, and Collaboration in Global Reactive Diluents Market
7. Global Reactive Diluents Market, By Product (USD Million) 2021-2034
7.1. Aliphatic
7.2. Aromatic
7.3. Cycloaliphatic
8. Global Reactive Diluents Market, By Application (USD Million) 2021-2034
8.1. Paints & Coatings
8.2. Composites
8.3. Adhesives & Sealants
8.4. Other Applications
9. Global Reactive Diluents Market, (USD Million) 2021-2034
9.1. Global Reactive Diluents Market Size and Market Share
10. Global Reactive Diluents Market, By Region, (USD Million) 2021-2034
10.1. Asia-Pacific
10.1.1. Australia
10.1.2. China
10.1.3. India
10.1.4. Japan
10.1.5. South Korea
10.1.6. Rest of Asia-Pacific
10.2. Europe
10.2.1. France
10.2.2. Germany
10.2.3. Italy
10.2.4. Spain
10.2.5. United Kingdom
10.2.6. Rest of Europe
10.3. Middle East and Africa
10.3.1. Kingdom of Saudi Arabia
10.3.2. United Arab Emirates
10.3.3. Qatar
10.3.4. South Africa
10.3.5. Egypt
10.3.6. Morocco
10.3.7. Nigeria
10.3.8. Rest of Middle-East and Africa
10.4. North America
10.4.1. Canada
10.4.2. Mexico
10.4.3. United States
10.5. Latin America
10.5.1. Argentina
10.5.2. Brazil
10.5.3. Rest of Latin America
11. Company Profile
11.1. SACHEM, Inc
11.1.1. Company details
11.1.2. Financial outlook
11.1.3. Product summary
11.1.4. Recent developments
11.2. Olin Corporation
11.2.1. Company details
11.2.2. Financial outlook
11.2.3. Product summary
11.2.4. Recent developments
11.3. Grasim Industries Limited
11.3.1. Company details
11.3.2. Financial outlook
11.3.3. Product summary
11.3.4. Recent developments
11.4. Cargill, Incorporated
11.4.1. Company details
11.4.2. Financial outlook
11.4.3. Product summary
11.4.4. Recent developments
11.5. Cardolite Corporation
11.5.1. Company details
11.5.2. Financial outlook
11.5.3. Product summary
11.5.4. Recent developments
11.6. Evonik Industries AG
11.6.1. Company details
11.6.2. Financial outlook
11.6.3. Product summary
11.6.4. Recent developments
11.7. Guangdong Haohui New Material Co., Ltd
11.7.1. Company details
11.7.2. Financial outlook
11.7.3. Product summary
11.7.4. Recent developments
11.8. Nippon Kayaku Co., Ltd
11.8.1. Company details
11.8.2. Financial outlook
11.8.3. Product summary
11.8.4. Recent developments
11.9. Mitsubishi Chemical Group Corporation
11.9.1. Company details
11.9.2. Financial outlook
11.9.3. Product summary
11.9.4. Recent developments
11.10. Others
12. Conclusion
13. List of Abbreviations
14. Reference Links
SPER Market Research’s methodology uses great emphasis on primary research to ensure that the market intelligence insights are up to date, reliable and accurate. Primary interviews are done with players involved in each phase of a supply chain to analyze the market forecasting. The secondary research method is used to help you fully understand how the future markets and the spending patterns look likes.
The report is based on in-depth qualitative and quantitative analysis of the Product Market. The quantitative analysis involves the application of various projection and sampling techniques. The qualitative analysis involves primary interviews, surveys, and vendor briefings. The data gathered as a result of these processes are validated through experts opinion. Our research methodology entails an ideal mixture of primary and secondary initiatives.