Graphene Quantum Dots Market Size, Share and Growth 2034

Global Graphene Quantum Dots Market Growth, Size, Trends Analysis - By Application - Regional Outlook, Competitive Strategies and Segment Forecast to 2034

Published: Sep-2025 Report ID: CHEM25172 Pages: 1 - 243 Formats*:     
Category : Chemical & Materials
Graphene Quantum Dots Market Introduction and Overview 

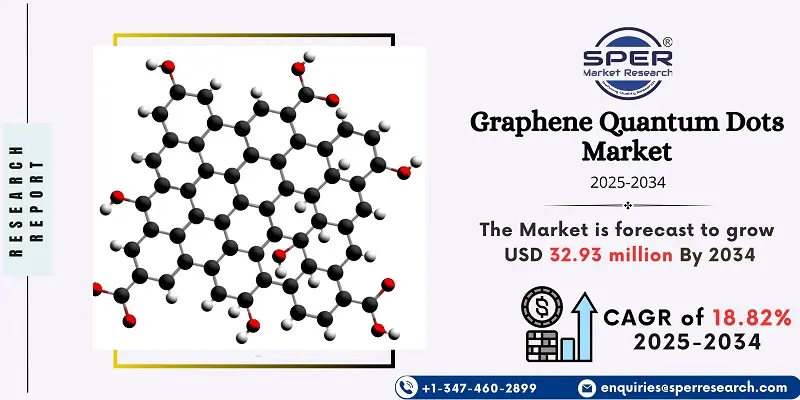
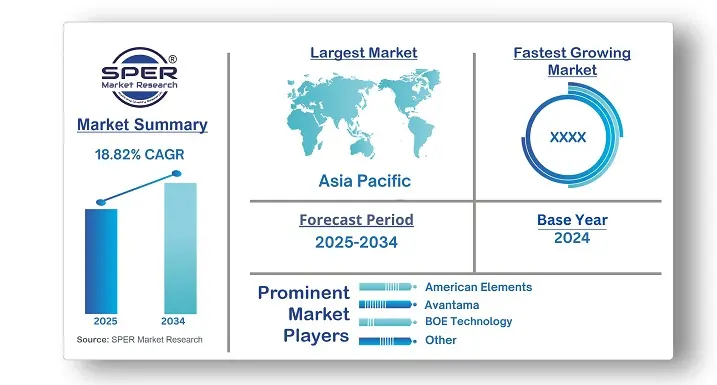
According to SPER Market Research, the Global Graphene Quantum Dots Market is estimated to reach USD 32.93 million by 2034 with a CAGR of 18.82%.

The report includes an in-depth analysis of the Global Graphene Quantum Dots Market, including market size and trends, product mix, Applications, and supplier analysis. The graphene quantum dots (GQDs) market was valued at approximately USD 5.87 million in 2024 and is projected to grow at an annual rate of 18.82% from 2025 to 2034. This growth is primarily driven by the rising demand for advanced nanomaterials in biomedical applications due to the favorable properties of GQDs, such as their biocompatibility, fluorescence, and low toxicity. These characteristics make GQDs suitable for bioimaging, drug delivery, and biosensing, leading to increased use in healthcare and pharmaceuticals. Continued research in nanomedicine and partnerships between academic and biotechnology sectors are expected to further boost the development of graphene-based solutions.
Graphene Quantum Dots Market
By Application Insights:
Electronic components were the market leader and had the highest revenue share in 2024. This trend is fueled by the demand for energy-efficient, miniaturized devices. GQDs possess excellent electrical conductivity and thermal stability, making them ideal for use in transistors, sensors, and optoelectronic components. The integration of GQDs in technologies linked to 5G, the Internet of Things (IoT), and artificial intelligence is enhancing performance in electronic devices. Additionally, the battery segment is anticipated to grow rapidly, driven by the need for high-performance energy storage in consumer electronics, electric vehicles (EVs), and renewable energy systems.

Regional Insights:
In 2024, the Asia Pacific region dominated the GQDs market thanks to private sector investments and government funding. In order to enhance their qualities for a variety of uses, China, Japan, and South Korea are leading the way in GQD research. The growing application of GQDs in healthcare, namely in cancer treatment and bioimaging, is driving market expansion. The development and commercialisation of GQDs are being advanced in North America by programs like the National Nanotechnology Initiative in the United States and the NSERC in Canada, which provide financing for important research projects.

Graphene Quantum Dots Market


Market Competitive Landscape:
The market's major participants are AUO and American Elements. A multinational producer of cutting-edge materials, American Elements specialises in high-purity chemicals, rare earth elements, and nanomaterials. They produce Graphene Quantum Dots for bioimaging, optoelectronics, and energy storage. AUO, based in Taiwan, specializes in display technology and electronic components, using Graphene Quantum Dots in their display panels to improve color accuracy and energy efficiency.

Recent Developments:
May 2025: Nanoco and POE (Guangdong Poly Optoelectronics Co., Ltd.) entered into a Licensing and Collaboration agreement. This partnership aims to develop cadmium-free quantum dot products for various applications, including advanced lighting films and displays. Samsung Display debuted a quantum dot ink recycling technology in October 2024 with the goal of making its QD-OLED screens more affordable. Through technological advancements that allow for the collection and reprocessing of unused QD ink during the QD-OLED manufacturing process, Samsung Display has successfully recovered and recycled over 80% of the ink that would otherwise go to waste in the production of the QD emissive layer.
In August 2023, UbiQD, Inc. entered into a joint development agreement with First Solar, Inc. to collaboratively investigate the integration of fluorescent quantum dot technology into next-generation solar modules.

Scope of the report:
 Report Metric Details
Market size available for years 2021-2034
Base year considered 2024
 Forecast period 2025-2034
Segments coveredBy Application
Regions coveredNorth America, Latin America, Asia-Pacific, Europe, and Middle East & Africa
Companies CoveredAmerican Elements, AUO, Avantama, BOE Technology, HANSOLCHEMICAL, LG, Merck KGaA, Microvision, Nanoco, NNCrystal.
Key Topics Covered in the Report:
  • Global Graphene Quantum Dots Market Size (FY 2021-FY 2034)
  • Overview of Global Graphene Quantum Dots Market
  • Segmentation of Global Graphene Quantum Dots Market By Application (Paints & Coatings, Electronic Components, Composites, Batteries)
  • Statistical Snap of Global Graphene Quantum Dots Market
  • Expansion Analysis of Global Graphene Quantum Dots Market
  • Problems and Obstacles in Global Graphene Quantum Dots Market
  • Competitive Landscape in the Global Graphene Quantum Dots Market
  • Details on Current Investment in Global Graphene Quantum Dots Market
  • Competitive Analysis of Global Graphene Quantum Dots Market
  • Prominent Players in the Global Graphene Quantum Dots Market
  • SWOT Analysis of Global Graphene Quantum Dots Market
  • Global Graphene Quantum Dots Market Future Outlook and Projections (FY 2025-FY 2034)
  • Recommendations from Analyst
1. Introduction
  • 1.1. Scope of the report
  • 1.2. Market segment analysis
2. Research Methodology
  • 2.1. Research data source
    • 2.1.1. Secondary Data
    • 2.1.2. Primary Data
    • 2.1.3. SPERs internal database
    • 2.1.4. Premium insight from KOLs
  • 2.2. Market size estimation
    • 2.2.1. Top-down and Bottom-up approach
  • 2.3. Data triangulation
3. Executive Summary

4. Market Dynamics
  • 4.1. Driver, Restraint, Opportunity and Challenges analysis
    • 4.1.1. Drivers
    • 4.1.2. Restraints
    • 4.1.3. Opportunities
    • 4.1.4. Challenges
5. Market variable and outlook
  • 5.1. SWOT Analysis
    • 5.1.1. Strengths
    • 5.1.2. Weaknesses
    • 5.1.3. Opportunities
    • 5.1.4. Threats
  • 5.2. PESTEL Analysis
    • 5.2.1. Political Landscape
    • 5.2.2. Economic Landscape
    • 5.2.3. Social Landscape
    • 5.2.4. Technological Landscape
    • 5.2.5. Environmental Landscape
    • 5.2.6. Legal Landscape
  • 5.3. PORTERs Five Forces 
    • 5.3.1. Bargaining power of suppliers
    • 5.3.2. Bargaining power of buyers
    • 5.3.3. Threat of Substitute
    • 5.3.4. Threat of new entrant
    • 5.3.5. Competitive rivalry
  • 5.4. Heat Map Analysis
6. Competitive Landscape
  • 6.1. Global Graphene Quantum Dots Market Manufacturing Base Distribution, Sales Area, Product Type 
  • 6.2. Mergers & Acquisitions, Partnerships, Product Launch, and Collaboration in Global Graphene Quantum Dots Market
7. Global Graphene Quantum Dots Market, By Application (USD Million) 2021-2034
  • 7.1. Paints & Coatings
  • 7.2. Electronic Components
  • 7.3. Composites
  • 7.4. Batteries
  • 7.5. Others
8. Global Graphene Quantum Dots Market, (USD Million) 2021-2034
  • 8.1. Global Graphene Quantum Dots Market Size and Market Share
9. Global Graphene Quantum Dots Market, By Region, (USD Million) 2021-2034
  • 9.1. Asia-Pacific
    • 9.1.1. Australia
    • 9.1.2. China
    • 9.1.3. India
    • 9.1.4. Japan
    • 9.1.5. South Korea
    • 9.1.6. Rest of Asia-Pacific
  • 9.2. Europe
    • 9.2.1. France
    • 9.2.2. Germany
    • 9.2.3. Italy
    • 9.2.4. Spain
    • 9.2.5. United Kingdom
    • 9.2.6. Rest of Europe
  • 9.3. Middle East and Africa
    • 9.3.1. Kingdom of Saudi Arabia 
    • 9.3.2. United Arab Emirates
    • 9.3.3. Qatar
    • 9.3.4. South Africa
    • 9.3.5. Egypt
    • 9.3.6. Morocco
    • 9.3.7. Nigeria
    • 9.3.8. Rest of Middle-East and Africa
  • 9.4. North America
    • 9.4.1. Canada
    • 9.4.2. Mexico
    • 9.4.3. United States
  • 9.5. Latin America
    • 9.5.1. Argentina
    • 9.5.2. Brazil
    • 9.5.3. Rest of Latin America 
10. Company Profile
  • 10.1. American Elements
    • 10.1.1. Company details
    • 10.1.2. Financial outlook
    • 10.1.3. Product summary 
    • 10.1.4. Recent developments
  • 10.2. AUO
    • 10.2.1. Company details
    • 10.2.2. Financial outlook
    • 10.2.3. Product summary 
    • 10.2.4. Recent developments
  • 10.3. Avantama
    • 10.3.1. Company details
    • 10.3.2. Financial outlook
    • 10.3.3. Product summary 
    • 10.3.4. Recent developments
  • 10.4. BOE Technology
    • 10.4.1. Company details
    • 10.4.2. Financial outlook
    • 10.4.3. Product summary 
    • 10.4.4. Recent developments
  • 10.5. HANSOLCHEMICAL
    • 10.5.1. Company details
    • 10.5.2. Financial outlook
    • 10.5.3. Product summary 
    • 10.5.4. Recent developments
  • 10.6. LG
    • 10.6.1. Company details
    • 10.6.2. Financial outlook
    • 10.6.3. Product summary 
    • 10.6.4. Recent developments
  • 10.7. Merck KGaA
    • 10.7.1.Company details
    • 10.7.2. Financial outlook
    • 10.7.3. Product summary 
    • 10.7.4. Recent developments
  • 10.8. Microvision
    • 10.8.1. Company details
    • 10.8.2. Financial outlook
    • 10.8.3. Product summary 
    • 10.8.4. Recent developments
  • 10.9. Nanoco
    • 10.9.1. Company details
    • 10.9.2. Financial outlook
    • 10.9.3. Product summary 
    • 10.9.4. Recent developments
  • 10.10. NNCrystal
    • 10.10.1. Company details
    • 10.10.2. Financial outlook
    • 10.10.3. Product summary 
    • 10.10.4. Recent developments
  • 10.11. Others
11. Conclusion

12. List of Abbreviations

13. Reference Links

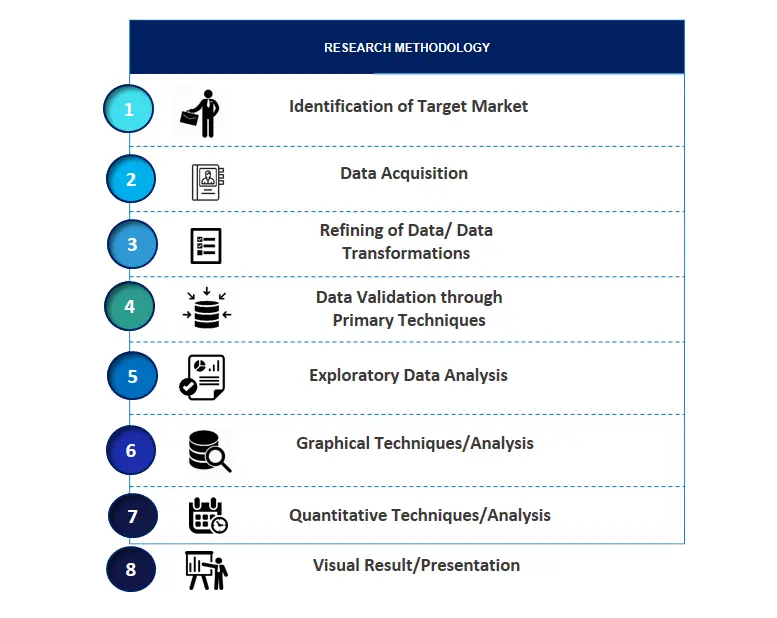
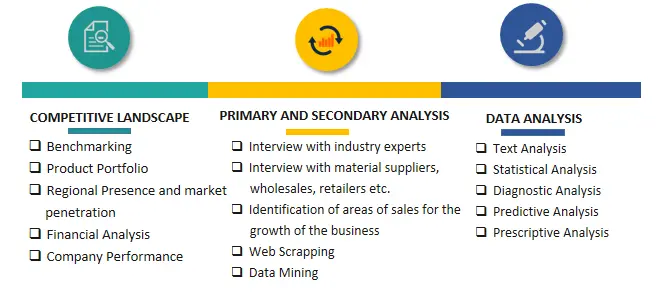
SPER Market Research’s methodology uses great emphasis on primary research to ensure that the market intelligence insights are up to date, reliable and accurate. Primary interviews are done with players involved in each phase of a supply chain to analyze the market forecasting. The secondary research method is used to help you fully understand how the future markets and the spending patterns look likes.

The report is based on in-depth qualitative and quantitative analysis of the Product Market. The quantitative analysis involves the application of various projection and sampling techniques. The qualitative analysis involves primary interviews, surveys, and vendor briefings.  The data gathered as a result of these processes are validated through experts opinion. Our research methodology entails an ideal mixture of primary and secondary initiatives.
SPER-Methodology-1

SPER-Methodology-2

SPER-Methodology-3


Frequently Asked Questions About This Report
Graphene Quantum Dots Market is covered By Application
Graphene Quantum Dots Market is projected to reach USD 32.93 million by 2034, growing at a CAGR of of 18.82% during the forecast period.
Graphene Quantum Dots Market grew in Market size from 2025. The Market is expected to reach USD 32.93 million by 2034, at a CAGR of 18.82% during the forecast period.
Graphene Quantum Dots Market CAGR of 18.82% during the forecast period.
You can get the sample pages by clicking the link - Click Here
Graphene Quantum Dots Market size is USD 32.93 million from 2025 to 2034.
The North America, Latin America, Asia-Pacific, Europe, and Middle East & Africa is the highest Market share in the Graphene Quantum Dots Market.
American Elements, AUO, Avantama, BOE Technology, HANSOLCHEMICAL, LG, Merck KGaA, Microvision, Nanoco, NNCrystal.
The report includes an in-depth analysis of the Global Graphene Quantum Dots Market, including market size and trends, product mix, Applications, and supplier analysis.
PLACE AN ORDER
  • 15 % off
     
    $ 4250
  • 20 % off
             
    $ 5650
  • 25 % off
         
    $ 7450
Pre-Purchase Inquiry
SEND AN INQUIRY
NEED CUSTOMIZATION?
Request Customization
CALL OR EMAIL US
US:
India:
Email:
100% Secure Payment

SPER American Express
SPER VISA
SPER Master Card
SPER Mestro
SPER Paypal
SPER CCAvenues

Have a glance of the Report

  Download Free Sample

Looking for Customization?

 Customization Request

Have a Question?

 Reach Our Analysis Team

COVID-19 impact analysis?

 Request Analysis

Our Global Clients

Our data-driven insights have influenced the strategy of 200+ reputed companies across the globe.

SPER-Astellas Pharma
SPER-Microsoft
SPER-EY
SPER-McKinsey
SPER-Bain
SPER-Max-Healthcare
SPER-DHL
SPER-IQVIA
SPER-Mitsubishi Logistics
SPER-PACCOR
SPER-Macmillan Education
SPER-Kankar IMRB
SPER-ITA
SPER-PWC
SPER-SAPTCA
SPER-Straumann
SPER-Danaher
SPER-AandM
SPER-MENARINI Silicon Biosystems
SPER-IPSOS
SPER-Heineken